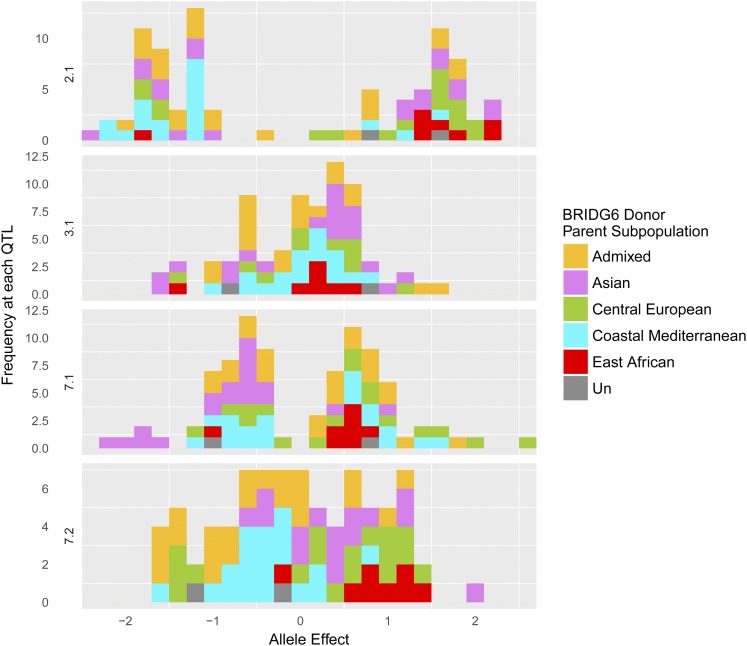
Figure 4.
Distribution of allele effect estimates at the four top QTL for flowering time (2.1, 3.1, 7.1, 7.2). The frequency of observations (Y-axis) are plotted at each allele effect relative to Rasmusson (X-axis). Estimates are the maximum allele effect per family for any significant SNP in the QTL. Bars are colored by the subpopulation assignment of the donor parent and are stacked. Orange (Admixed), purple (Asian), green (Central European), blue (Coastal Mediterranean), red (East African), and dark gray (Unassigned).

