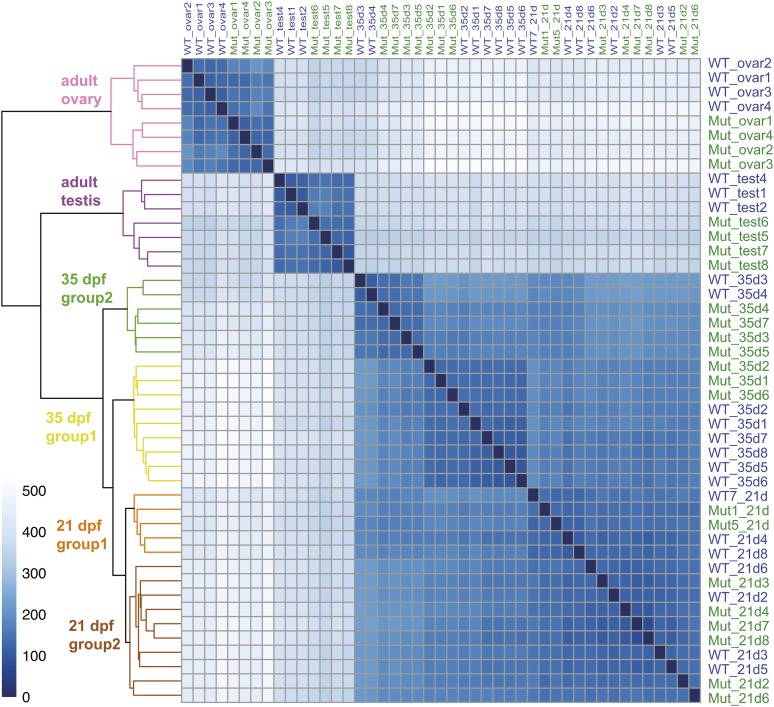
Figure 6.
Heat map and dendrogram of regularized log-transformed Euclidean distances between all 45 RNA-seq samples. Analysis divided samples into six groups: adult ovary, adult testes, two groups of 35 dpf trunks, and two groups of 21 dpf trunks. The intensity of each cell in the panel reflects the number of genes different in the intersecting two samples according to the scale at the left, so the diagonal self-comparisons show no genes differently expressed.

