Figure 3.
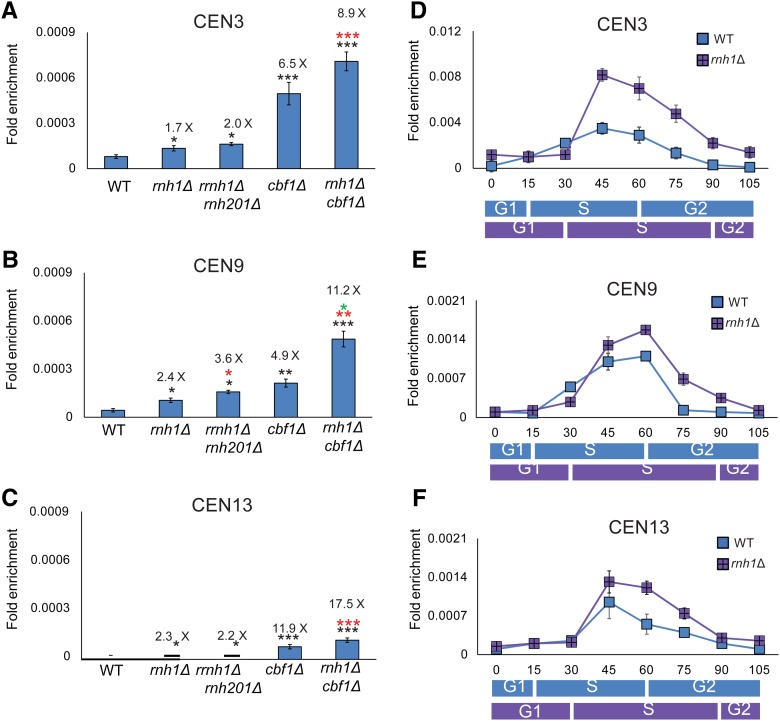
Cen-RNA abundance is increased in rnh1Δ cells in mid–late S phase. Cen-RNA levels were determined by RT-PCR in asynchronous cultures grown in YPD at 30° (A) CEN3, (B) CEN9, and (C) CEN13 in WT and mutant strains (names of strains are under bars). The numbers above the bars indicate the fold difference in cen-RNA in mutants compared to WT cells. Black asterisks indicate P-values relative to WT. Red asterisks indicate P-values relative to rnh1Δ. Green asterisks indicate P-values relative to cbf1Δ. (D–F) show cen-RNA levels in 24°-grown cells synchronized as described in the legend for Figure 1 at (D) CEN3, (E) CEN9, and (F) CEN13. RNA levels in WT cells (blue square) and rnh1Δ cells (purple square) are shown at each time point. The scale for (D) (CEN3) is different from those of (E and F). The approximate timings of the cell cycle transitions for WT (blue rectangle) and rnh1Δ (purple rectangle) are indicated beneath the graphs, as determined by FACs analysis (Figure S1A and Figure S2F). cen-RNA, centromeric RNA; WT, wild-type.

