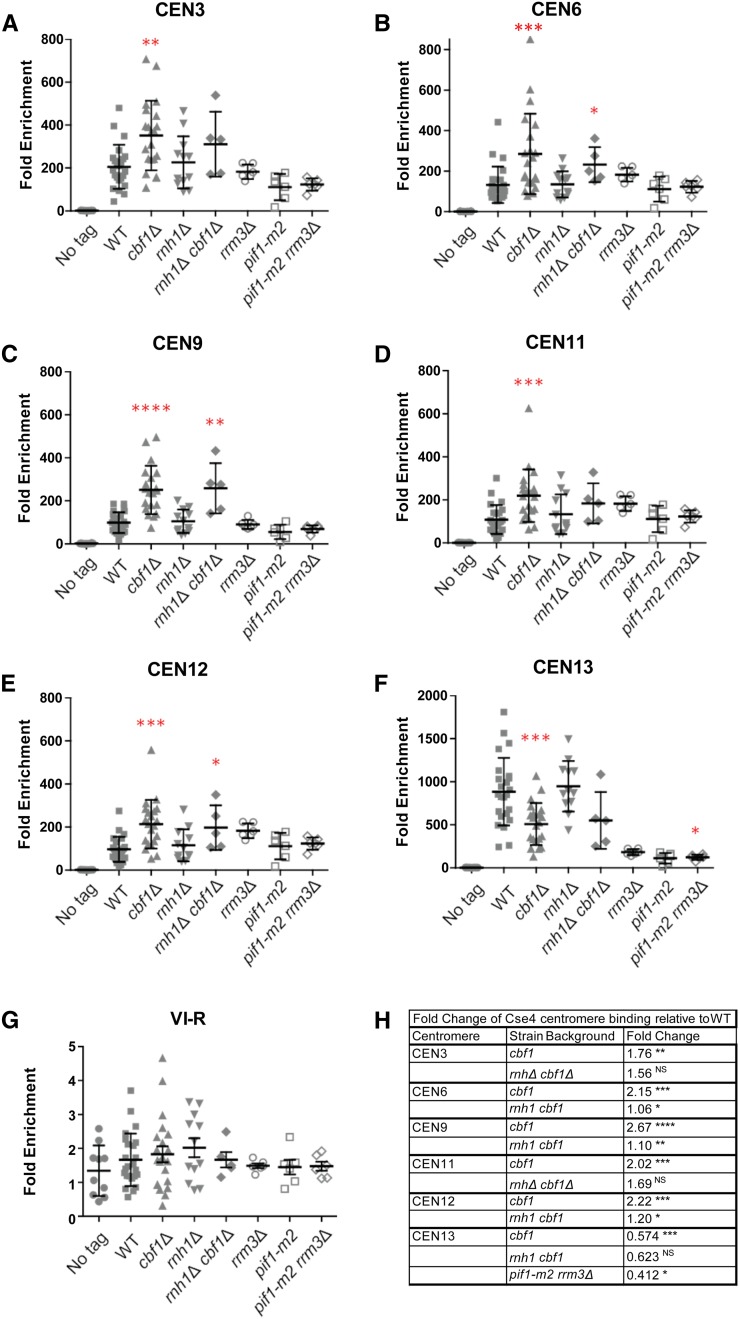
Figure 6.
Altered levels of cen-RNA correlate with changes in Cse4 centromere binding. Scatter plots of Cse4-Myc9 binding to centromeres in asynchronous WT and mutant cells growing in YPD at 30°, as determined by ChIP. (A) CEN3, (B) CEN6, (C) CEN9, (D) CEN11, (E) CEN12, (F) CEN13, and (G) VI-R telomere (control). Quantified as ([ChIP/Input] Target site/[ChIP/Input] ARO1). Cross bars indicate means and SD. The paired two sample for means Student’s t-test, with the hypothesized mean difference set at 0, was used to calculate significance. In all figures, * P ≤ 0.05, ** P ≤ 0.01, *** P ≤ 0.001, and **** P ≤ 0.0001. Graphs show data points from several ChIP experiments consisting of three biological replicates per experiment. (H) Table showing centromeres and strains where there were significant changes in Cse4 binding compared to binding at the same CEN in WT cells. The third column shows fold change in Cse4 binding in the indicated mutants relative to WT. The scales for CEN13 and telomere VI-R are different from those of other panels in the figure. cen-RNA, centromeric RNA; ChIP, chromatin immunoprecipitation; NS, no significance; WT, wild-type.

