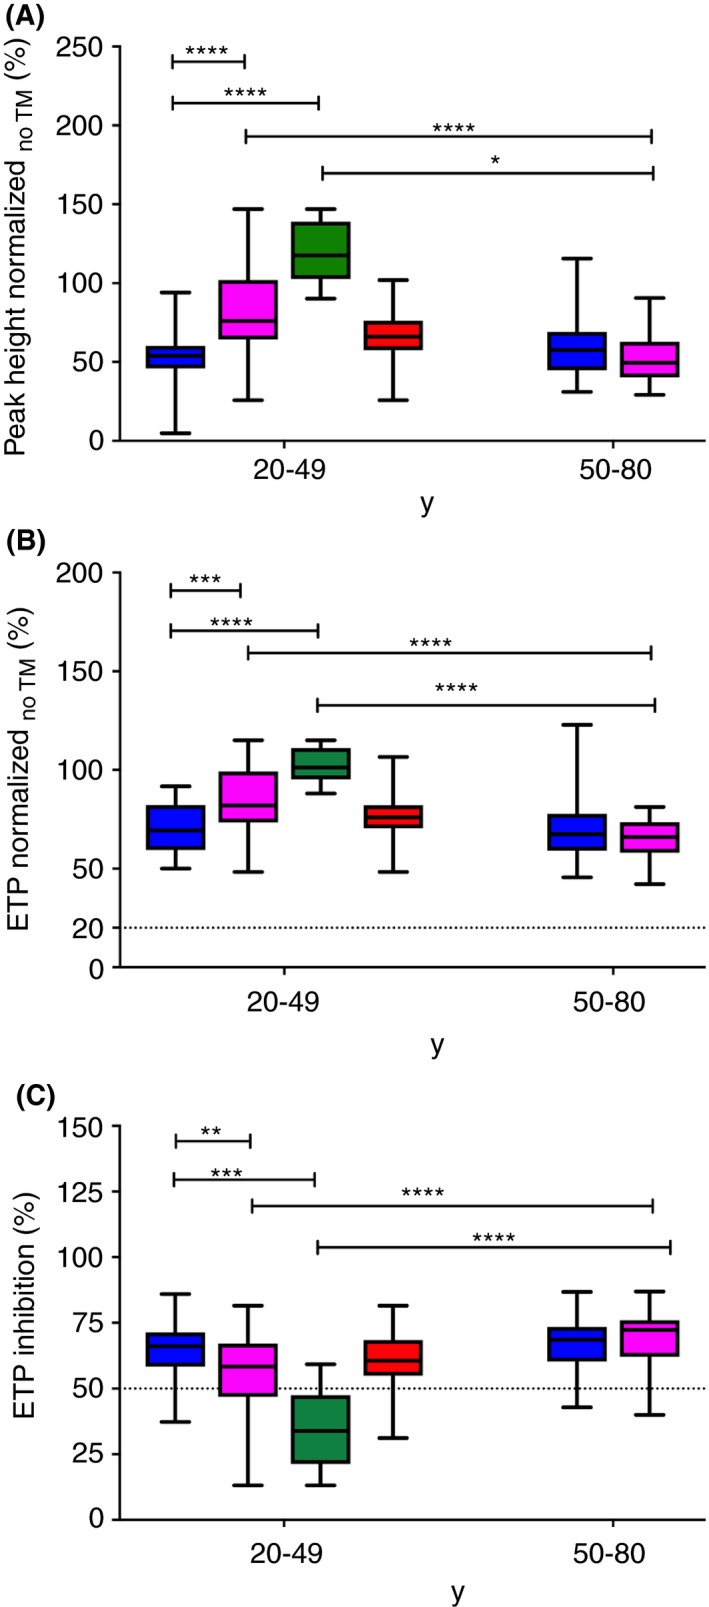
Figure 2.

ST Genesia ThromboScreen parameters in the age categories 20‐49 and 50‐80, respectively. (A) Peak height normalized. (B) Endogenous thrombin potential (ETP) obtained in absence of thrombomodulin normalized. (C) Endogenous thrombin potential (ETP) obtained in presence of thrombomodulin normalized. Data from all men are shown by blue boxes. Data from all women are shown by pink boxes. Data from women aged 20‐49 are divided in 2 groups: women using oral contraception (green boxes) and women not using oral contraception (red boxes). Medians and interquartile ranges are indicated. Groups were compared using the Mann‐Whitney U‐test. The dotted lines show the threshold proposed by STAGO. TM, thrombomodulin; ns, not significant; **P < 0.01; ***P < 0.001; ****P < 0.0001
