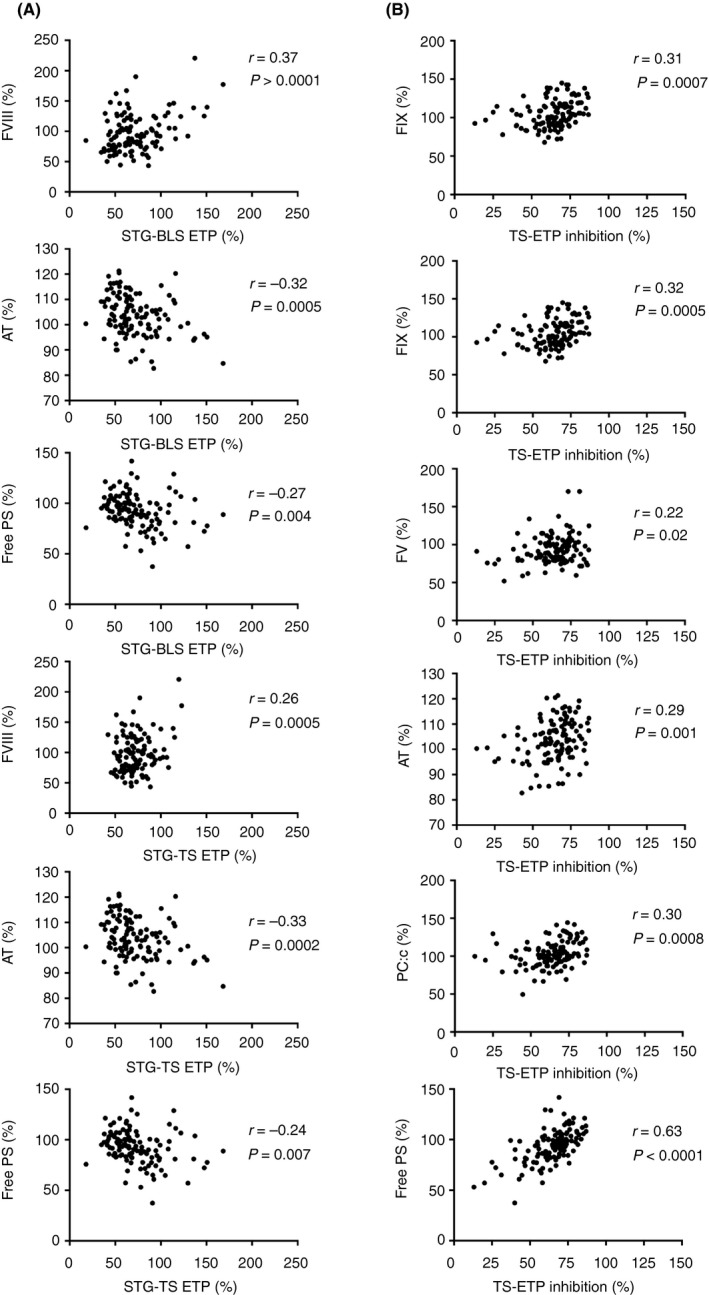
Figure 3.

Correlations between some hemostasis/thrombophilia parameters and ETP values in the study group. (A) ETP was measured using the BleedScreen assay and the ThromboScreen assay. (B) Endogenous thrombin potential (ETP) inhibition was measured using the ThromboScreen (TS) assay in presence/absence of thrombomodulin. AT, antithrombin; ETP, endogenous thrombin potential; FIX, factor IX; free PS, free protein S; FV, factor V; FVIII, factor VIII; PC:c, protein C coagulant; r, Pearson coefficient; STG‐BLS, BleedScreen; STG‐TS, ThromboScreen
