Abstract
Purpose
Chitosan nanoparticles (CS NPs) have been used as a good vehicle for nano-drug delivery due to their good physicochemical properties. Epigallocatechin-3-gallate (EGCG), one of the major active ingredients of green tea, is a natural antioxidant that helps in reducing and preventing cell damage and fighting cancer, plus providing other benefits. The aim of this study is to optimise the preparation parameters in terms of the physical characteristics and stability in CS/EGCG NPs conjugation.
Results
The conjugation of CS/EGCGNPs was obtained by means of Poloxamer 188. The average CS/EGCG NPs complex was of size 117.8±38.71nm with a surface charge of +67.8±4.38mV and isoelectric point at pH 7.61.
Conclusion
In conclusion, NPs produced were stable at 4°C with nanometric size, good polydispersity, good loading and efficiency, envisaging to be a possible candidate for nano-therapeutic delivery system against hepatic fibrosis.
Keywords: chitosan, EGCG, conjugation, nano-drug delivery
Introduction
Nano-drug delivery has attracted much attention due to its unique physical, chemical and biological properties. It has become a bright spot in biochemical research. It is emerging as a prospective biomedical tool with applications in diagnostics, specific drug delivery and therapeutics for diseases. That is to say, it is a method of delivering drugs to a biological system in a manner that increases the amount of the drug in such parts of the system with high affinity. In this technique, conjugated nanoparticles (NPs) and their carriers are employed. This mean of delivery is largely useful in making such drug reaching its target cells and tissues of an organ thereby smarter than the conventional manner.1 One of the major advantages of nano-drug delivery technique is to spontaneously allow the NPs to reach its specific diseased target, thereby avoiding interaction with healthy tissue.2 The goal of a drug delivery system is known to prolong the effects and to have a protected drug interaction with the diseased tissue, as the system releases the drug in a dosage form.3,4 The advantages of such system are the reduction in the frequency of the dosages taken by the patient, having a more uniform effect of the drug side effects,5 and reduced fluctuation in circulating drug levels, thereby preventing any damage of the healthy tissue,6 whereas the conventional delivery system is based on the absorption of the drug across a biological membrane, which depends on the type of the cell and its location in the body.7 However, the disadvantages of nano-drug delivery system still need to be tested.
Although gold NPs are not the main objective in this study, yet, the use of gold, chitosan, and epigallocatechin gallate (EGCG) NPs has recently been developed as a smart mean of drug delivery system for the treatment of various kinds of diseases, such as cancer, diabetes and neurodegenerative diseases.7,8 Drug delivery system is a promising technique in years to come, where it will overcome the conventional treatment for cancer, diabetes, gastro-intestinal disorder, endocrine diseases, etc.6–10 The aim of this work is to elaborate more on the use of such technique for a more efficient and better release of nano-drug for therapeutic treatment of hepatic fibrosis as one of the major diseases worldwide.
Materials And Methods
Sample Preparation
In the preparation of NPs, cleaning of glassware is very crucial. Thus, all the glassware and stirring magnetic bars were thoroughly cleaned in freshly prepared aqua regia (HCl/HNO3 3:1, v/v) and then rinsed with distilled water and dried, to avoid aggregation of residual gold particle and to avoid unwanted nucleation during synthesis.
Preparation Of Gold NPs
In this report, gold NPs have been prepared and used for the sake of morphological comparison with other NPs under study.
Ten milligrams of HAuCl4 was dissolved in 100 mL of deionized water (0.25 mM), and shaken properly to mix the solution. Solution of reducing agent (NaBH4) was prepared by dissolving 1.891 of NaBH4 in 500 mL of deionized water. Then, 100 mL of HAuCl4 (0.25 mM) was taken in 250 mL flask with magnetic stirring at 750 rpm and 50 drops of the reducing agent solution was added drop by drop with continuous stirring. The color of HAuCl4 solution changed to dark red over several seconds. Stirring process was continued for another 10 mins for complete homogenization. Since the HAuCl4 is corrosive, a glass spatula was used to avoid the contact with metal. All the gold NPs batches were stored in the dark to minimize the photo-induced oxidation. The UV absorption spectra were recorded between 190 and 1100nm on spectrophotometer. The zeta potential was also measured. Particles size analysis was done using transmission electron microscope (TEM), scanning electron microscopy (SEM) and atomic force microscopy (AFM) images.
Preparation Of Chitosan/TPP NPs
Two percent acetic acid solution was prepared in deionized water. LMW chitosan was dissolved in the aqueous solution of acetic acid to form a 0.5mg/mL chitosan solution. (Total 30mL prepared, so 15mg of chitosan was dissolved in 30mL of 2% acetic acid). The chitosan solution was stirred overnight at room temperature using a magnet stirrer. The pH of the resulting solution was around 3.6 and this was adjusted to 4.7–4.8 using 20 wt% aqueous sodium hydroxide solution. The chitosan solution was then passed through a syringe filter (pore size 0.45 µm, Millipore, USA) to remove residues of insoluble particles. Tripolyphosphate (TPP) was dissolved in ultrapure water at a concentration of 0.5 mg/mL and also passed through a syringe filter (pore size 0.45µm, Millipore, USA). Ten milliliters of chitosan solution was taken in a vial and was then placed on the magnetic stirrer stirring at 700 rpm. 1.0 mL of 2–4°C TPP solution was quickly added to the chitosan solution with a micropipette. The reaction was carried out for 10 mins and the resulting suspension was subjected to further analysis. UV spectra scanned between 190 and 1000nm.
Preparation Of Gold/Chitosan NPs
A total of 100 µL of 0.125M concentrated aqueous solution of chloroauric acid (HAuCl4) was reduced by heating at 100°C for 15 mins in 100 mL of low molecular weight chitosan solution prepared in 1% acetic acid to yield a ruby-red solution. The ruby-red colored solution yielded an absorbance maximum at 520 nm. Varying chitosan concentrations (0.05%, 0.01%, 0.1%, 0.2%, 0.5% and 1%) were used for reduction of chloroauric acid.11
Preparation Of EGCG/Chitosan NPs
0.1% Low molecular weight chitosan (Sigma) solution was prepared in 1% acetic acid. Twenty-five milligrams of Poloxamer 18812 was dissolved in 5mL of the above chitosan solution. 0.05% EGCG (Sigma) solution was prepared in distilled water. 0.025% TPP solution (Merck) was prepared in distilled water. Five milliliters of chitosan solution was added to 50 mL of EGCG solution upon stirring at room temperature. To the above solution, 0.5mL of TPP solution was added drop-wise under stirring for 3 hrs at a speed of 1000rpm. The solution formed was translucent. The solution was centrifuged at 14,000 rpm for 10 mins using high-speed tabletop centrifuge (Hermle, Z36HK). The UV absorption spectra were recorded between 190 and 1100nm on spectrophotometer (Cary win 50 UV). The particle size and zeta potential and isoelectric points were measured using Malvern Instrument (Nano ZS, green badge). Particle characteristics investigation and acquiring were done on a Jeol 1200 EXII electron microscope (JEOL Ltd, Tokyo, Japan), operated at 80 kV with magnification from 150 to 200 K, and on the variable pressure field emission remotely operated scanning electron microscope 9 Leo Supra 50 VP operated at 30 kV with magnification of 40K and the Atomic Force Microscope Veeco Nanoscope IV Multimode AFM Model No. NMAFMLN (Figure 6) for fabrication of Poloxamer (P188) loaded chitosan NPs via ionic gelation between the positively charged amino groups of chitosan (CS) and negatively charged triphosphate (TPP) with EGCG trapped in.
Figure 6.
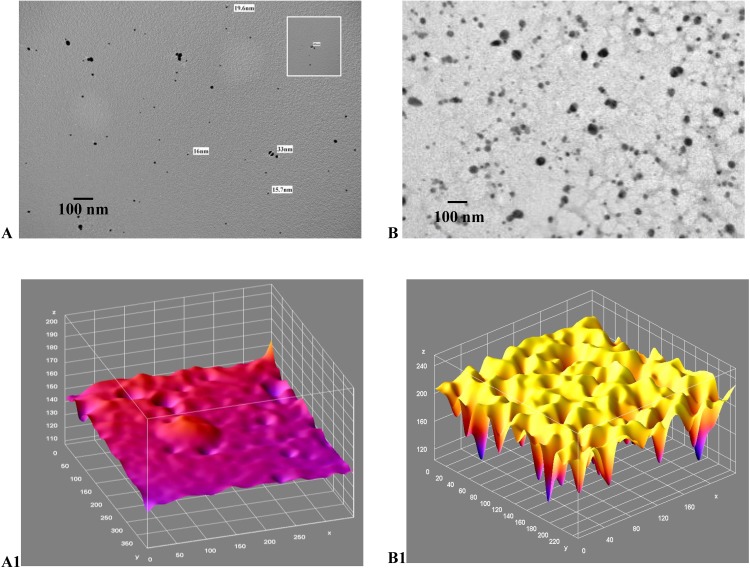
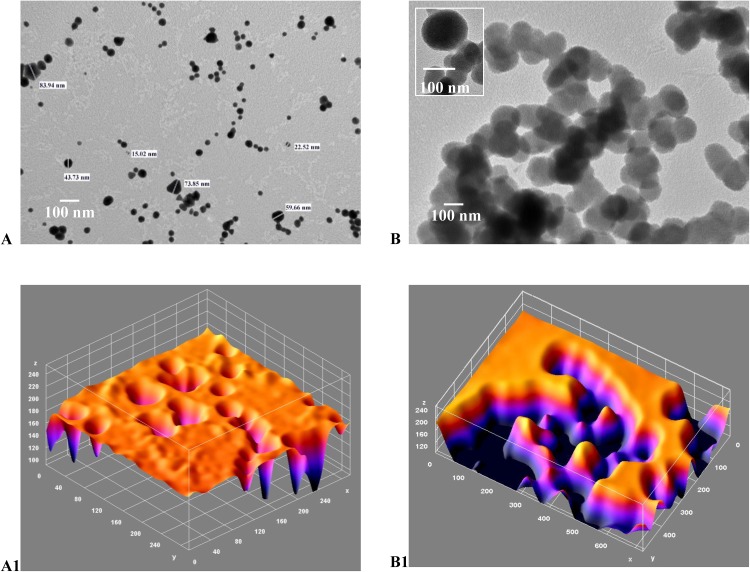
(A-B1): TEM image and corresponding ImageJ analysis. (A) TEM for gold NPs of various size and shape, size 47.03±45.55 (d, nm); (B) TEM image of chitosan/TPP NPs, size 156±45.55 (d, nm); (A1) ImageJ for (A and B1) ImageJ for 6B with peaks denoting the intensity of the NPs in each case. Scale bars 300 nm.
Transmission Electron Microscopy
Preparation Of Gold NPs, Chitosan NPs, Gold/Chitosan NPs And EGCG/Chitosan NPs For TEM
NPs preparations of gold, chitosan, gold/chitosan conjugation and EGCG/chitosan conjugation were done almost the same for examination in the TEM. Pasteur capillary pipette 150mm, rubber bulb, Formvar carbon-coated copper grids 150 mesh, tweezers for handling the grids and ultrasonicator were used during sample preparation for the TEM. The sample in the form of solution was ultrasonicated for 15 to 45 mins to insure homogeneity. Using the tweezers it was picked out the grid from the grid box and placed it on a filter paper previously set into a petri dish. 150mm Pasteur glass pipette was used to take 1mL of the desired specimen to be examined. The pipette was inserted into the solution just under the surface level at the center of the vial. One to 2 drops of solution was added on the Formvar carbon-coated grid and let dry in the desiccator to keep it safe from contamination. Thus, samples are ready for TEM examination. The grid was placed in the specimen holder using the tweezers for examination in STEM JEM-1200 EX II JEOL Scanning Transmission Electron Microscope at magnifications of 200 to 250K operated at 80kV.
Field Emission Scanning Electron Microscopy (FESEM)
Preparation Of Gold NPs, Chitosan NPs, Gold/Chitosan NPs And EGCG/Chitosan NPs For The FESEM
NPs preparations of gold, chitosan, gold/chitosan and EGCG/chitosan conjugation were done almost in the same way, for examination in the FESEM samples were prepared in the same way for the four NPs. The NPs were poured on washed clean cover slip and fixed on big stub ready for dehydration. The mounted materials were covered and left at room temperature for a few hours and later in a desiccator. The stubs were put in the critical point drying machine then in the sputter coater for shadowing with platinum/gold. Investigation and image acquisition were done on the variable pressure field emission remotely operable scanning electron microscope (Leo Supra 50VP) operated at 30 kV.
ImageJ Analysis
ImageJ software program (Freeware ImageJ V 1.51 A) public domain image processing program developed at the National Institutes of Health13–15 was applied to images. Statistical analysis was performed: Gaussian size distribution (standard deviation), shape and error analysis of NPs were carried out using freeware ImageJ and statistical software Origin Pro2019 to plot the data excel sheet for UV and ZP and ZS.
Atomic Force Microscopy (AFM)
Preparation Of Gold NPs, Chitosan NPs, Gold/Chitosan NPs And EGCG/Chitosan NPs For The AFM
NPs solutions of gold, chitosan, gold/chitosan and EGCG/chitosan were spread on a mica substrate on the AFM Stub and were allowed to dry overnight. The dried sample was then mounted on the AFM Multimode for scanning with TappingMode Tip. The AFM Multimode used was VEECO Nanoscope IV Multimode microscope and the Tapping Mode Tip used was RTESP tip. Topographical images (height mode) were acquired. Three-dimensional (3D) analysis was employed to distinguish roughness and morphological features.
Fourier-Transform Infrared Spectroscopy (FTIR)
The samples of the three solutions (EGCG, chitosan and EGCG/chitosan) were stored in vials in a freezer prior to freeze-drying at −18°C. The freeze dryer temperature and pressure were approximately –40°C and 133×10−3 mbar, respectively. The vials were then transferred into the lyophilisation flask and loaded onto the Freeze Dryer (Labconco, Freezone 18 USA). Once loaded, waited for 5 mins to verify that the pressure is 133×10−3 mbar or lower. The flask was disconnected from the manifold one by one after the sample is completely dried and used for the FTIR analysis. The powder sample and KBr (Sigma) was ground to reduce the particle size to <5 mm in diameter. 0.2mg of KBr was added into an agate mortar and ground it to fine powder until crystallites can no longer be seen, and it becomes somewhat “pasty” and sticks to the mortar. 2mg of powder sample was mixed with the KBr powder. The mixture was ground for 3–5 mins then it was put into the Pike‐Press Pellet (Vacuum crusher, Model pike crush IR Pike Tech, Madison). The powder was then pressed for 2 mins to form a thin and transparent pellet. The pellet was taken out carefully and transferred onto the sample holder of the FTIR (Varian 640-IR spectrometer, Randburg) for analysis.
X-Ray Photoelectron Spectroscopy (XPS)
X-Ray Photoelectron Spectroscopy (ESCA Lab 250xi (Thermo))
XPS spectra were recorded on a Thermo ESCALAB 250 Xi using monochromatic Al Kα radiation (1486.6eV) with a spot size of 850µm. The spectra acquisition and processing were carried out using the software Thermo Avantage. The sample was stuck on the sample holder using a double-sided carbon tape and then introduced into the preparation chamber and was degassed until the proper vacuum was achieved. Then, it was transferred into the analysis chamber where the vacuum was 10−9 mbar. The analysis was carried out using the following parameters: pass energy of 20eV, dwell time 50ms and the step size 0.1eV.
Results
Characterization
UV-Vis Spectroscopy
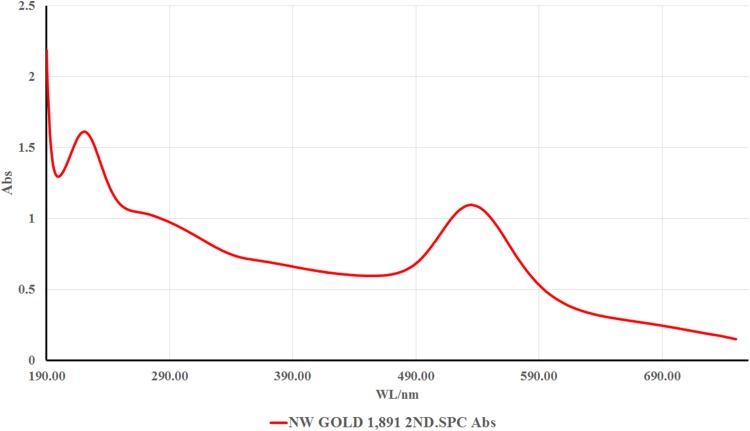
The UV-Vis absorption spectra of all samples were measured in the range 200–1000 nm. The results showed that they have no absorption peaks in visible region for all samples. However, the maximum absorption peak for gold NPs was clearly detected at 520 nm (see Figure 1), whereas there was no absorption for chitosan, gold/chitosan and EGCG/chitosan.
Figure 1.
UV-Vis absorption spectrum of gold NPs at 520 nm.
Zeta Potential And Size Measurements Of NPs
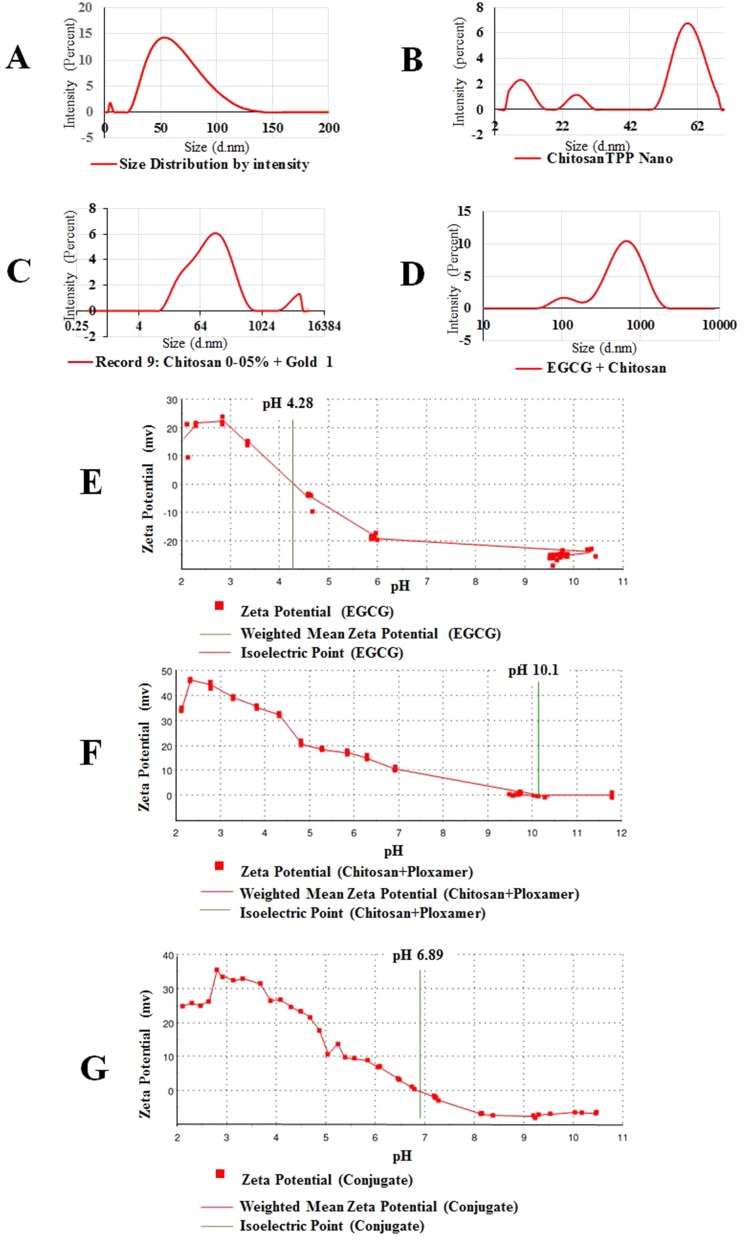
According to the protocol used in this work, four different NPs have been used, namely gold NPs, in the form of HAuCl4 and reducing agent (NaBH4). The NPs obtained were of size 47.03±45.55 (d.nm), and PdI of 0.328, zeta potential was 56 mV, as shown in Figure 2A. In comparison to the previous case chitosan TPP NPs of size 156±45.55 nm and PdI 0.38, zeta potential −12.9±8.07 mV (Figure 2B). Gold/chitosan NPs have size of 160.3±36.17 nm and have PdI of 0.581 whereas the zeta potential was of 63.9±4.01 mV (as shown in Figure 2C). EGCG/chitosan NPs have size of 414.8±333.8 nm and PdI 0.363, zeta potential of 67.6±4.38 mV (Figure 2D). The size of the four NPs prepared in this work varied from small (<200 nm) to large (more than 400 nm). Isoelectric point for EGCG/chitosan was at a neutral point pH 7.4 (see Figure 2E).
Figure 2.
DLS data (A) gold NPs (zeta size 47.03±45.55 (d, nm) and PdI 0.328, zeta potential 39.5±5.74 (mV)); (B) chitosan TPP NPs (zeta size 156±45.55 (d, nm) and PdI 0.381, zeta potential −12.9±8.07 (mV)); (C) gold/chitosan NPs DLS data (zeta size 160.3±36.17 (d, nm) and PdI 0.581, zeta potential 63.9±4.01 (mV); (D) EGCG/chitosan NPs (zeta size 414.8±333.8 (d, nm) and PdI 0.363, zeta potential 67.6±4mV); (E) weighted mean zeta potential (EGCG), isoelectric point at pH 4.28 (EGCG), after centrifugation and auto-titration (F) weighted mean zeta potential (chitosan/poloxamer), isoelectric point at pH10.1 after centrifugation and auto-titration; (G) weighted mean zeta potential (chitosan/EGCG). Isoelectric point at pH 6.89 (chitosan/EGCG conjugation), after centrifugation and auto-titration.
Isoelectric Point
The isoelectric points of the three components were calculated: EGCG has isoelectric point at pH 4.28 (EGCG), after centrifugation and auto-titration (reported in Figure 2F), chitosan/poloxamer weighted mean zeta potential (chitosan/poloxamer) has isoelectric point at pH 10.1 after centrifugation (see Figure 2G) and auto-titration. While for chitosan/EGCG conjugate, isoelectric point is at pH 6.89 (chitosan/EGCG conjugation), after centrifugation and auto-titration.
FTIR Spectra And The Bindings Of EGCG-Chitosan Conjugates
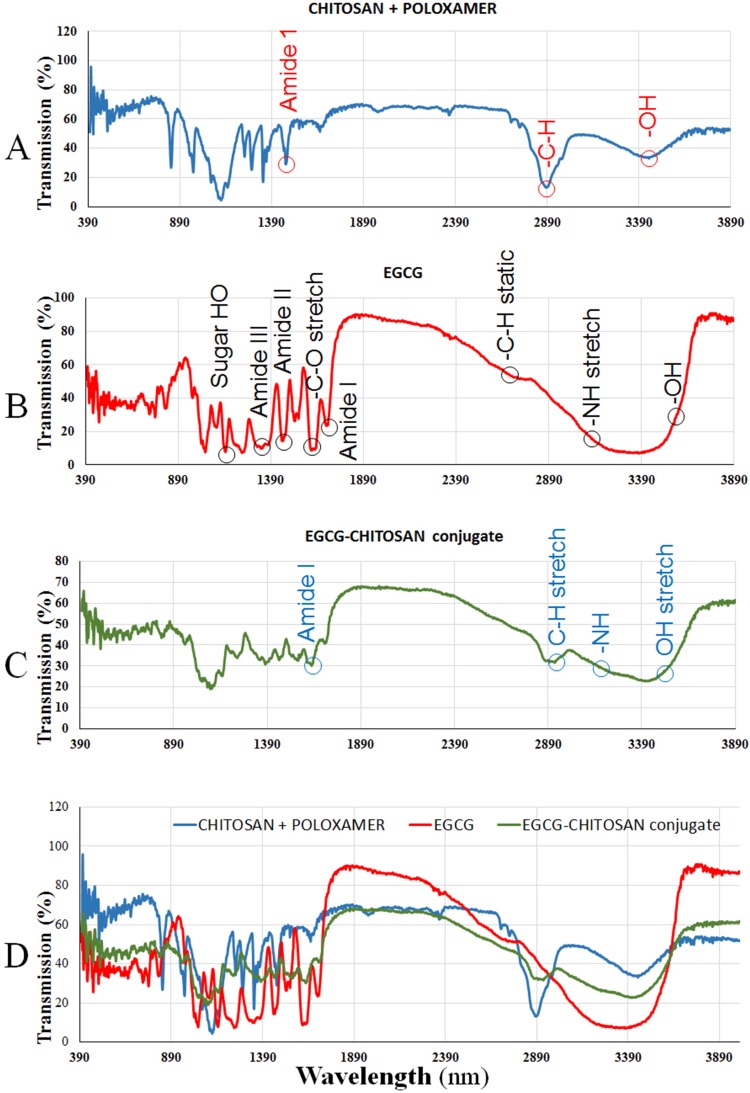
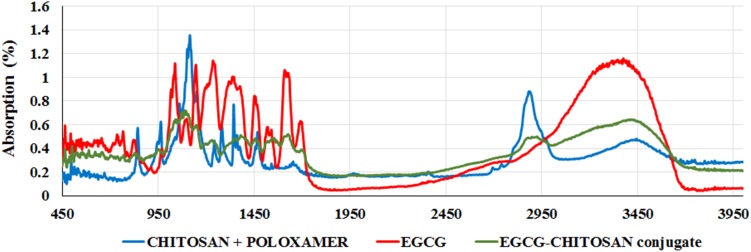
FTIR data show the percentage of transmission spectral changes for chitosan, EGCG and EGCG/chitosan conjugate (shown in Figure 3A–C) and with the final setting at a combined form (see Figure 3D). The infrared spectrum of chitosan/poloxamer was measured in the region of wavelength 1400–4000 nm, while for EGCG was very strong in the regions 1000–4000 nm, and for EGCG/chitosan conjugate was 1800–4000 nm. However, with FTIR absorption curve shifting and intensity variations, of chitosan/poloxamer amide of I band was approximately 500–270 cm−1, EGCG 1000–3700 cm−1 and EGCG/chitosan conjugate 1000–380 cm−1 (as reported in Figure 4), while the position of peak centers for EGCG/chitosan conjugate is clearly seen in Figure 5.
Figure 3.
FTIR spectra recorded in the region of 900–4500 cm−1 of (A) chitosan/poloxamer, (B) EGCG, (C) EGCG/chitosan conjugation and self-assembled NPs and (D) combined (A–C).
Figure 4.
FTIR absorption spectra recorded in the region of 900–4500 cm−1 of (light blue) chitosan/poloxamer (red) EGCG (green) EGCG/chitosan conjugation.
Figure 5.
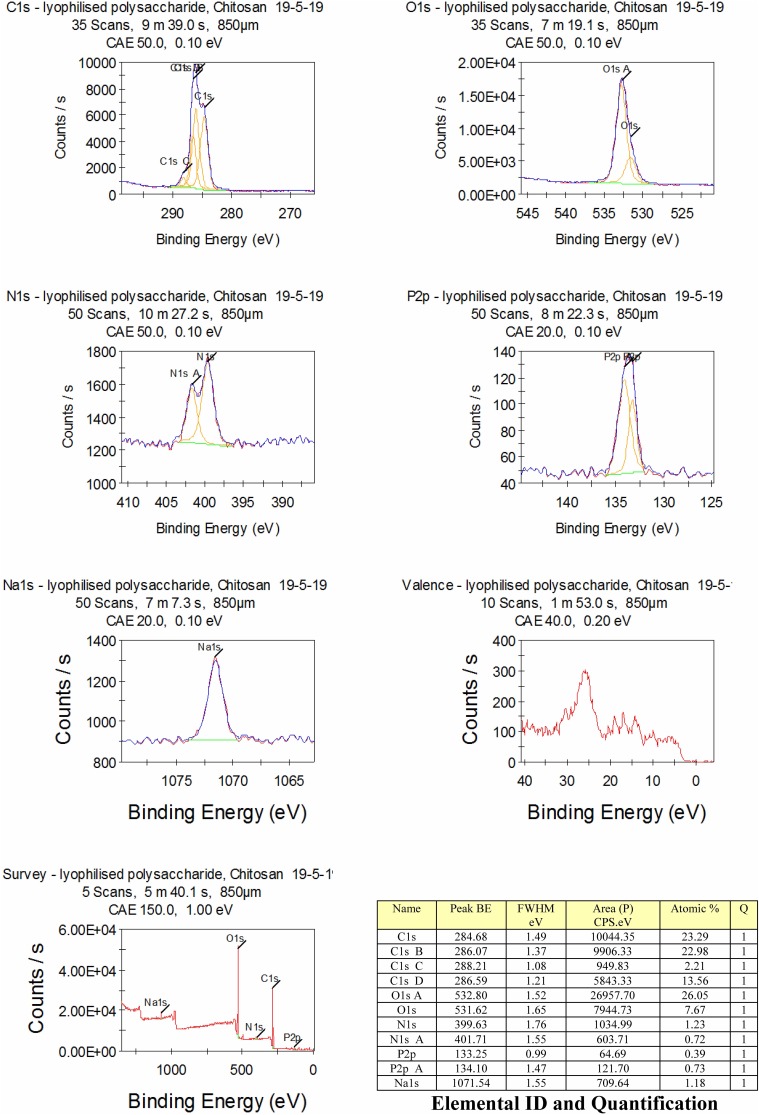
XPS spectra of lyophilized EGCG/chitosan conjugate and a table of elemental ID and quantification at various binding energy (eV) levels.
X-Ray Photoelectron Spectroscopy (XPS)
Since the objective of this study is to measure counts per second (CPS) as a function of kinetic energy (eV) of emission for electrons from atoms in the surface material, that is measured in units of CPS eV, variation in intensity for electrons with differing emission energies provides a means for characterizing the electronic state of atoms within the sample under study from which electrons are emitted and offers quantifiable information about the surface composition of EGCG/chitosan conjugate: this indicates that the conjugate was successfully formed (Figure 5).
Transmission Electron Microscopy (TEM)
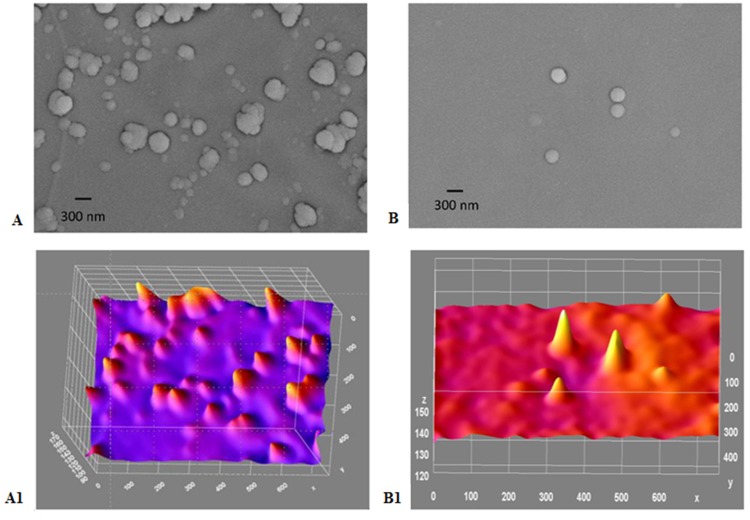
Under TEM analysis, gold NPs were detected as very clear crystals, ranging in size of 47.03±45.55 nm, with various shapes: cubes, cube-octahedrons, octahedron, tetrahedron, decahedron and icosahedron. However, the majority of the NPs were spherical in shape (see Figure 6A). Chitosan/TPP NPs were of various sizes ranging from 156±45.55 nm, opaque particles (as shown in Figure 6B), with peaks clearly shown in ImageJ for gold NPs (as in Figure 6A1) and for chitosan/TPP NPs (see Figure 6B1). However, for gold/chitosan NPs, TEM shows more particle variations in size of 160.3±36.17nm and shape: triangular, pentagonal and hexagonal but the majority were of spherical shape (shown in Figure 7A), with 3D peaks as seen in ImageJ (Figure 6A1). For EGCG/chitosan/TPP NPs, we observed the size of 414.8±333.8 nm (Figure 6B). Peaks of such variations are very clearly detected when ImageJ Software was applied (Figure 6B1).
Figure 7.
(A-B1): TEM image and corresponding ImageJ analysis. (A) TEM for gold/chitosan NPs of various size and shape, size 160.3±36.17 (d, nm); (B) TEM image of EGCG/chitosan/TPP NPs, size 414.8±333.8 (d, nm); (A1) ImageJ for (A and B1) ImageJ for 7B with peaks denoting the intensity of the NPs in each case. Scale bars 300 nm.
Field Emission Scanning Electron Microscopy (FESEM)
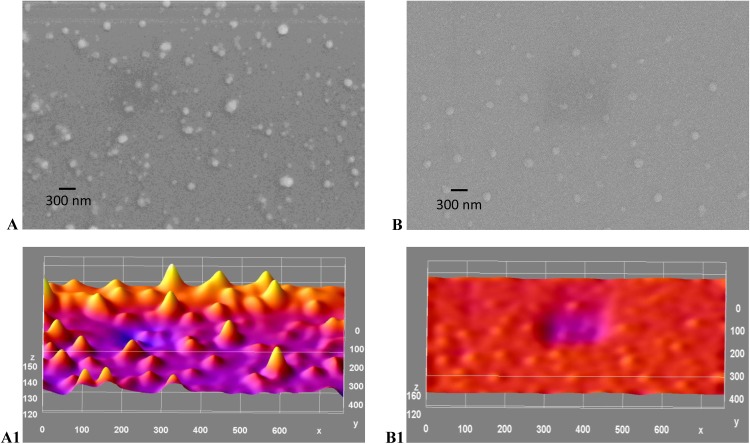
The morphology of the four NPs: (such as gold, chitosan, gold/chitosan and EGCG/chitosan conjugation) was determined with the field emission scanning electron microscope (see Figure 7A–B1). The size of gold NPs was 47.03±45.55nm (in Figure 7A). Chitosan/TPP NPs size was 156±45.55 nm, old/chitosan was 160.3±36.17nm and EGCG/chitosan/TPP NPs were found the largest size (414.8±333.8nm). The peaks were obtained by the 3D profile surface structures at different sections as X, Y and Z by using ImageJ analysis: they showed NPs profile and distribution ImageJ (as shown in Figure 7A–B1).
Atomic Force Microscopy (AFM)
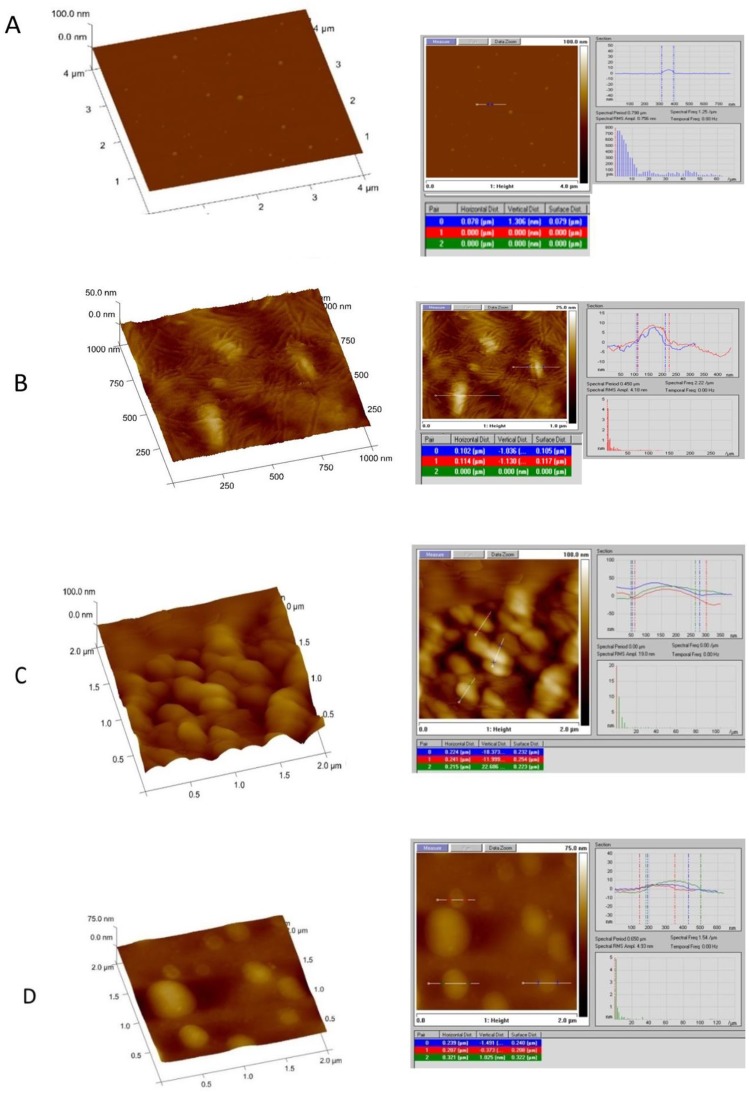
The 3D surface topography and section topography of gold, chitosan, gold/chitosan and EGCG/chitosan NPs were investigated over square areas of 1 μm×1 μm using AFM in a multimodal analysis. Topographic characterization of surface samples in amplitude and height have revealed a pattern of surface characteristics of the NPs (data not shown). Highlighted 3D surfaces for three different NPs have been estimated by the multi-fractal measures (see Figures 8 and 9, too). Topographical view of the gold NPs under the AFM confirms the small size and sharp ranging in size of 47.03±45.55nm, as shown in the 3D data image as well as the section data image (as in Figure 10A). Chitosan NPs show less crystalline nature with size average of 156±45.55nm (shown in Figure 10B). Gold/chitosan-conjugated NPs appear quite larger in size 160.3±36.17 nm (see Figure 10C), whereas EGCG/chitosan-conjugated NPs have shown much larger size 414.8±333.8 nm (reported in Figure 10D).
Figure 8.
(A-B1): SEM image and corresponding ImageJ analysis. (A) Gold NPs of various size and shape, zeta size 47.03±45.55 (d, nm); (B) SEM image for chitosan/TPP NPs, zeta size 156±45.55 (d, nm); (A1) ImageJ for 8A and (B1) ImageJ for A with peaks denoting the intensity of the NPs in each case. Scale bars 300 nm.
Figure 9.
(A-B1): SEM image and ImageJ analysis. (A) Gold/chitosan NPs, size and shape, zeta size 160.3±36.17 (d, nm); (B) SEM image of EGCG/chitosan/TPP NPs with size of zeta size 414.8±333.8 (d, nm); (A1)ImageJ for (A and B1) ImageJ for (B) with peaks denoting the intensity of the NPs in each case. Scale bars 300 nm.
Figure 10.
AFM image analysis for NPs showing 3D (left) and section data (right) of: (A) gold; (B) chitosan; (C) gold/chitosan and (D) EGCG/chitosan.
Discussion
The structure, size, distribution and characteristics of the four NPs prepared and studied in this work are fully in agreement with previous studies7,16–19 and further extended when their morphological characteristics have been well investigated in TEM, FESEM and AFM.11,20–26 It has to be noted that the purpose of using gold NPs in this report was for the sake of morphological comparison with the other three NPs under study.
Drug-Loaded NPs
The scope of this work was to optimise the ideal way to prepare chitosan (CS) as a carrier for the herbal drug EGCG NPs through the ionic interaction of a positively charged CS solution18,27–32 and negatively charged TPP solution.8,28–30,32–34 The charge and density of both CS and TPP solution have a great effect on the ionic interaction. An automatic isoelectric titration instrument was used to investigate the relationship between the pH value and the charge density (zeta potential) of CS and TPP solution.4,28 The selection of optimum charge density is a critical step for effective ionic interactions. Apart from the individual NPs, of gold, CS, gold/CS tested, the zeta potential of CS and EGCG conjugated solution was pH 7.61 at which the zeta potential reached almost 67.6±4mV, zeta size 414.8±333.8 (d, nm) and PdI 0.363, zeta potential.6,8 In the case of TPP solution, the pH value drops dramatically from −2 to −22.5mV when its pH increases from 5.25 to 7.25. By considering the influence of pH on both CS and TPP solution, the pH range of 5.5–6.5 was chosen for the formulation of combination drug-loaded NPs in this work, because a relatively high absolute zeta potential was obtained for both TPP and CS solution in this range, which was favoured by the crosslinking of the oppositely charged solution.
The conjugation of the EGCG/CS and TPP NPs are very stable by all means. Likewise the NPs size either as individual preparation or as final conjugated EGCG/CSNPs is maintained in a nanometric range. Accordingly, the conjugation appears to be moderately efficient as final products, especially the conjugation of EGCG loading into chitosan that results in a final product EGCG/CS NPs that represents a model for nano-drug delivery.22
Efficiency Of Chitosan NPs As Nano-Carrier
Chitosan is known for its biocompatibility and as penetration enhancer owing to its electronegative property, and also act as an electrostatic stabilizer.13,22,27 Being a polysaccharide, chitosan in specific aids in the attachment of the biomolecules as well render optimum stability and subsequently help to improve the uptake of the NPs. By varying chitosan solution concentrations for the formation of EGCG/CS NPs, we have demonstrated that lower concentrations of 0.01% w/v–0.05% w/v resulted in aggregated particles as seen in the AFM images. Otherwise, other concentrations of each component have shown no aggregation.12,16,35
To elucidate the cause of aggregation in such chitosan concentrations, we have measured zeta potential. This measurement allows predictions about the stability of colloidal aqueous dispersions. Usually, particle aggregation is less likely to occur for charged particles with optimum zeta potential (eg, higher than 30 mV) due to electrostatic repulsions.
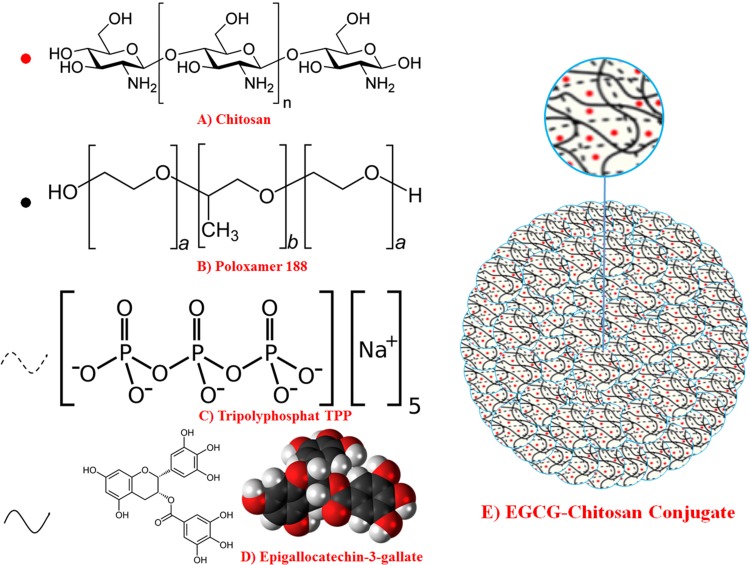
The initial components in this study were chitosan via the N-deacetylated product of the polysaccharide chitosan combined with Poloxamer 188 which has low toxicity, high stability capacity: the possibility of interaction with chitosan through hydrogen bonding and its excellent drug-release characteristics are explored in the polymer’s use as a drug delivery vehicle for a variety of therapeutic agents.25 Thus, specific interactions between EGCG and chitosan were responsible for the self-assembly of the two NPs (see Figure 11A–D).
Figure 11.
(A) Chemical structure of chitosan, (B) tripolyphosphate (TPP), (C) Poloxamer 188 (D) EGCG and (E) fabrication of Poloxamer (P188) loaded with chitosan nanoparticles via ionic gelation between the positively charged amino groups of chitosan (CS) and negatively charged tripolyphosphate (TPP) with EGCG trapped in.
The FTIR experiment was used to assess the functional groups present in the three components, namely chitosan, EGCG and EGCG/CS.36,37 The FTIR spectra of the original chitosan and EGCG powders as well as the EGCG/CS assembled NPs were measured. Chitosan showed absorption bands at around 900–4500 cm−1 due to the vibration of the O-H linkage of phenolic hydroxyl groups.25,38 EGCG displayed absorption bands at 1000 cm−1 and 3500 cm−1 that are assigned to N-H (amide II) bending, respectively. Hydrogen bonding between aliphatic and aromatic O-H groups, respectively, on chitosan and EGCG is observed for O-H stretching since this peak shifted from 1000cm−1 for chitosan toward 3500 cm−1 and became broad for values of chitosan/EGCG NPs.38 Although the peaks for EGCG/CS conjugation are clearly depicted, yet they require a thorough study to extract the exact positions of all the bonds involved to extract the exact positions of all the bonds involved (as shown in Figure 5) in the “Results” section. Nevertheless, FTIR spectra demonstrated undoubtedly the successful loading of EGCG inside chitosan NPs due to specific bonds ascribed to EGCG, envisaging the possible use of such nano-construct to encapsulate and later release active molecules or drugs.
The future work will be devoted to further study in understanding the quantification of loading, mechanism and quantification of release. Investigation of interaction of NPs with biological medium, ie, in vitro data and in vivo on animal model will focus on hepatic fibrosis. For the final state of the EGCG/chitosan conjugate testing, XPS was conducted using a Thermo Scientific ESCALAB-250Xi spectrometer. The radiation source was monochromatic of AlK operating with a power of 300 W (15 kV, 20 mA) vacuum, the analysis chamber was higher than 7×10⁻⁹ mbar during all the measurements. The results indicate the successful layer-by-layer assembly of the chitosan and the formation of EGCG/chitosan conjugate after reacting the EGCG with chitosan through TPP and Poloxamer 188 crosslinking.
Conclusion
In this report, chitosan/EGCG NPs have been synthesized successfully and chitosan was efficiently loaded with EGCG. The colloidal stability, zeta size, zeta potential and isoelectric pH 7.61, FTIR spectra (both transmission and absorption) and full bioimaging of the NPs were systematically investigated. It was demonstrated the successful preparation of gold, chitosan NPs and conjugated gold/chitosan NPs. Such successful loading of EGCG in chitosan envisages a potential nano-drug delivery system for the future use in the treatment of hepatic fibrosis disorder.
Acknowledgments
Authors gratefully acknowledge the Nanoscopy Science Center (NSC) technical staff and Mr Ayman E. El-Sharkawey, Faculty of Science, RSPU Unit and NanoLab, College of Engineering, Kuwait University for the use of the equipment. Abdel-Majeed Safer wishes to thank Kuwait University for granting him 1 year sabbatical leave for performing research in nano-drug delivery in Kuwait and in CNR NANOTEC-Istituto di Nanotecnologia, Lecce, Italy.
Disclosure
The authors report no conflicts of interest in this work.
References
- 1.Lin YH, Chen ZR, Lai CH, Hsieh CH, Feng CL. Active targeted nanoparticles for oral administration of gastric cancer therapy. Biomacromolecules. 2015;16(9):3021–3032. doi: 10.1021/acs.biomac.5b00907 [DOI] [PubMed] [Google Scholar]
- 2.Dahiya S, Rani R, Kumar S, Dhingra D, Dilbaghi N. Chitosan-gellan gum bipolymeric nanohydrogels—a potential nanocarrier for the delivery of epigallocatechin gallate. BioNanoScience. 2017;7(3):508–520. doi: 10.1007/s12668-017-0416-0 [DOI] [Google Scholar]
- 3.Goodrich CP, Brenner MP, Ribbeck K. Enhanced diffusion by binding to the crosslinks of a polymer gel. Nat Commun. 2018;9(1):4348. doi: 10.1038/s41467-018-06851-5 [DOI] [PMC free article] [PubMed] [Google Scholar]
- 4.Li P, Wang Y, Peng Z, She F, Kong L. Development of chitosan nanoparticles as drug delivery systems for 5-fluorouracil and leucovorin blends. Carbohydr Polym. 2011;85(3):698–704. doi: 10.1016/j.carbpol.2011.03.045 [DOI] [Google Scholar]
- 5.Mahanta AK, Senapati S, Paliwal P, Krishnamurthy S, Hemalatha S, Maiti P. Nanoparticle-induced controlled drug delivery using chitosan-based hydrogel and scaffold: application to bone regeneration. Mol Pharmaceutics. 2019;16(1):327–338. doi: 10.1021/acs.molpharmaceut.8b00995 [DOI] [PubMed] [Google Scholar]
- 6.Xiao B, Zhang Z, Viennois E, et al. combination therapy for ulcerative colitis: orally targeted nanoparticles prevent mucosal damage and relieve inflammation. Theranostics. 2016;6(12):2250–2266. doi: 10.7150/thno.15710 [DOI] [PMC free article] [PubMed] [Google Scholar]
- 7.Granja A, Frias I, Neves AR, Pinheiro M, Reis S. Therapeutic potential of epigallocatechin gallatenanodelivery systems. Biomed Res Int. 2017;2017:5813793. doi: 10.1155/2017/5813793 [DOI] [PMC free article] [PubMed] [Google Scholar]
- 8.Granja A, Pinheiro M, Reis S. Epigallocatechin gallatenanodelivery systems for cancer therapy. Nutrients. 2016;8:5. doi: 10.3390/nu8050307 [DOI] [PMC free article] [PubMed] [Google Scholar]
- 9.Zeng L, Yan J, Luo L, Ma M, Zhu H. Preparation and characterization of (-)-Epigallocatechin-3-gallate (EGCG)-loaded nanoparticles and their inhibitory effects on human breast cancer MCF-7 cells. Sci Rep. 2017;7:45521. doi: 10.1038/srep45521 [DOI] [PMC free article] [PubMed] [Google Scholar]
- 10.Yang R, Tian J, Wang D, Blanchard C, Zhou Z. Chitosan binding onto the epigallocatechin loaded ferritin nanocage enhance its transport across Caco-2 cells. Food Funct. 2018;9(4):2015–2024. doi: 10.1039/c8fo00097b [DOI] [PubMed] [Google Scholar]
- 11.Bhumkar DR, Joshi HM, Sastry M, Pokharkar VB. Chitosan reduced gold nanoparticles as novel carriers for transmucosal delivery of insulin. Pharm Res. 2007;24(8):1415–1426. doi: 10.1007/s11095-007-9257-9 [DOI] [PubMed] [Google Scholar]
- 12.Cafaggi S, Leardi R, Parodi B, Caviglioli G, Russo E, Bignardi G. Preparation and evaluation of a chitosan salt-poloxamer 407 based matrix for buccal drug delivery. J Control Release. 2005;102(1):159–169. doi: 10.1016/j.jconrel.2004.09.019 [DOI] [PubMed] [Google Scholar]
- 13.Lin YH, Feng CL, Lai CH, Lin JH, Chen HY. Preparation of epigallocatechin gallate-loaded nanoparticles and characterization of their inhibitory effects on Helicobacter pylori growth in vitro and in vivo. Sci Technol Adv Mater. 2014;15(4):045006. doi: 10.1088/1468-6996/15/4/045006 [DOI] [PMC free article] [PubMed] [Google Scholar]
- 14.Available from: http://rsb.info.nih.gov/ij. USA: ImageJ is a public domain Java Image Processing program inspired by NIH. Accessed 2008. [Google Scholar]
- 15.Abramoff MD, Magalhaes PJ, Ram SJ. Image processing with image. J Biophotonics Intl. 2004;11:36. [Google Scholar]
- 16.Peter B, Bosze S, Horvath R. Biophysical characteristics of proteins and living cells exposed to the green tea polyphenol epigallocatechin-3-gallate (EGCg): review of recent advances from molecular mechanisms to nanomedicine and clinical trials. EurBiophys J. 2017;46(1):1–24. doi: 10.1007/s00249-016-1141-2 [DOI] [PubMed] [Google Scholar]
- 17.Hoseinpour V, Ghaemi N. Green synthesis of manganese nanoparticles: applications and future perspective-A review. J PhotochemPhotobiolB. 2018;189:234–243. doi: 10.1016/j.jphotobiol.2018.10.022 [DOI] [PubMed] [Google Scholar]
- 18.Liang J, Li F, Fang Y, et al. Cytotoxicity and apoptotic effects of tea polyphenol-loaded chitosan nanoparticles on human hepatoma HepG2 cells. Mater Sci Eng C Mater BiolAppl. 2014;36:7–13. doi: 10.1016/j.msec.2013.11.039 [DOI] [PubMed] [Google Scholar]
- 19.Iqbal M, Usanase G, Oulmi K, et al. Preparation of gold nanoparticles and determination of their particles size via different methods. Mater Res Bull. 2016;79:97–104. doi: 10.1166/jcsb.2015.1127 [DOI] [Google Scholar]
- 20.Safer A-M. Emerging possibilities of green tea as a potential treatment regimen for hepatic fibrosis. Global J Nanomed. 2017;2:1–6. [Google Scholar]
- 21.Li W, Yalcin M, Lin O, Ardawi M-SM, Mousa SA. Self-assembly of green tea catechin derivatives in nanoparticles for oral lycopene delivery. J Control Release. 2017;248:117–124. doi: 10.1016/j.jconrel.2017.01.009 [DOI] [PubMed] [Google Scholar]
- 22.Yin Y, Cui L, Yan F, Zhang Z, Li W, Wang L. Epigallocatechin gallate based magnetic gold nanoshells nanoplatform for cancer theranostic applications. J Mater Chem B. 2017;5(3):454–463. doi: 10.1039/C6TB02408D [DOI] [PubMed] [Google Scholar]
- 23.Yang R, Liu Y, Gao Y, Wang Y, Blanchard C, Zhou Z. Ferritin glycosylated by chitosan as a novel EGCG nano-carrier: structure, stability, and absorption analysis. Int J Biol Macromol. 2017;105:252–261. doi: 10.1016/j.ijbiomac.2017.07.040 [DOI] [PubMed] [Google Scholar]
- 24.Safer A-MA, Hanafy NA, Bharali DJ, Cui H, Mousa SA. Effect of green tea extract encapsulated into chitosan nanoparticles on hepatic fibrosis collagen fibers assessed by atomic force microscopy in rat hepatic fibrosis model. J Nanosci Nanotechnol. 2015;15(9):6452–6459. doi: 10.1166/jnn.2015.10608 [DOI] [PubMed] [Google Scholar]
- 25.Chen YC, Yu SH, Tsai GJ, Tang DW, Mi FL, Peng YP. Novel technology for the preparation of self-assembled catechin/gelatin nanoparticles and their characterization. J Agric Food Chem. 2010;58(11):6728–6734. doi: 10.1021/jf1005116 [DOI] [PubMed] [Google Scholar]
- 26.Dube A, Nicolazzo JA, Larson I. Chitosan nanoparticles enhance the intestinal absorption of the green tea catechins (+)-catechin and (-)-epigallocatechin gallate. Eur J Pharm Sci. 2010;41(2):219–225. doi: 10.1016/j.ejps.2010.06.010 [DOI] [PubMed] [Google Scholar]
- 27.Fan W, Yan W, Xu Z, Ni H. Formation mechanism of monodisperse, low molecular weight chitosan nanoparticles by ionic gelation technique. Colloids Surf B Biointerfaces. 2012;90:21–27. doi: 10.1016/j.colsurfb.2011.09.042 [DOI] [PubMed] [Google Scholar]
- 28.Hu B, Ting Y, Yang X, Tang W, Zeng X, Huang Q. Nano chemo prevention by encapsulation of (-)-epigallocatechin-3-gallate with bioactive peptides/chitosan nanoparticles for enhancement of its bioavailability. ChemCommun (camb). 2012;48(18):2421–2423. doi: 10.1039/c2cc17295j [DOI] [PubMed] [Google Scholar]
- 29.Liang J, Cao L, Zhang L, Wan X-C. Preparation, characterization, and in vitro antitumor activity of folate conjugated chitosan coated EGCG nanoparticles. Food Sci Biotechnol. 2014;23(2):569–575. doi: 10.1007/s10068-014-0078-4 [DOI] [Google Scholar]
- 30.Liang J, Yan H, Puligundla P, Gao X, Zhou Y, Wan X. Applications of chitosan nanoparticles to enhance absorption and bioavailability of tea polyphenols: a review. Food Hydrocoll. 2017;69:286–292. doi: 10.1016/j.foodhyd.2017.01.041 [DOI] [Google Scholar]
- 31.Hu B, Ting Y, Zeng X, Huang Q. Cellular uptake and cytotoxicity of chitosan-case in phosphopeptides nanocomplexes loaded with epigallocatechin gallate. CarbohydrPolym. 2012;89(2):362–370. doi: 10.1016/j.carbpol.2012.03.015 [DOI] [PubMed] [Google Scholar]
- 32.Ramkumar Ponnuraj JK, Gopalakrishnan S, Senthilnathan K, Meganathan V, Saravanan P. Formulation and characterization of epigallocatechin gallate nanoparticles. Am J Pharm Res. 2015;5(01). doi: 10.1044/1980-iajpr.150122 [DOI] [Google Scholar]
- 33.Schneider CA, Rasband WS, Eliceiri KW. NIH image to ImageJ: 25 years of image analysis. Nat Method. 2012;9(7):671–675. doi: 10.1038/nmeth.2089 [DOI] [PMC free article] [PubMed] [Google Scholar]
- 34.Bhumkar DR, Joshi HM, Sastry M, Pokharkar VB. Chitosan reduced gold nanoparticles as novel carriers for transmucosal delivery of insulin. Pharm Res. 2007;24:1415–1426. doi: 10.1007/s11095-007-9257-9 [DOI] [PubMed] [Google Scholar]
- 35.Liu F, Majeed H, Antoniou J, et al. pH and temperature stability of (-)-epigallocatechin-3-gallate-beta-cyclodextrin inclusion complex-loaded chitosan nanoparticles. Carbohydr Polym. 2016;149:340–347. doi: 10.1016/j.carbpol.2016.04.100 [DOI] [PubMed] [Google Scholar]
- 36.Fernandes Queiroz M, Karoline R, Melo T, Sabry DA, Lanzi SG, Oliveira Rocha HA. Does the use of Chitosan contribute to oxalate kidneystone formation? Mar Drugs. 2015;13:141–158. doi: 10.3390/md13010141 [DOI] [PMC free article] [PubMed] [Google Scholar]
- 37.Manikandan M, Kannan K, Manavalan R. Compatibility studies of camptothecin with various pharmaceutical excipients used in the development of nanoparticle formulation. Int J Pharm Pharm Sci. 2013;5:315–321. [Google Scholar]
- 38.Safer A-M. A quantitative description of lipid and extracellular matrix proteinaceous fibers in hepatic fibrosis of a rat model by imagej using nano-images. J Text Sci Eng. 2017;08:03. doi: 10.4172/2157-7439.1000446 [DOI] [Google Scholar]


