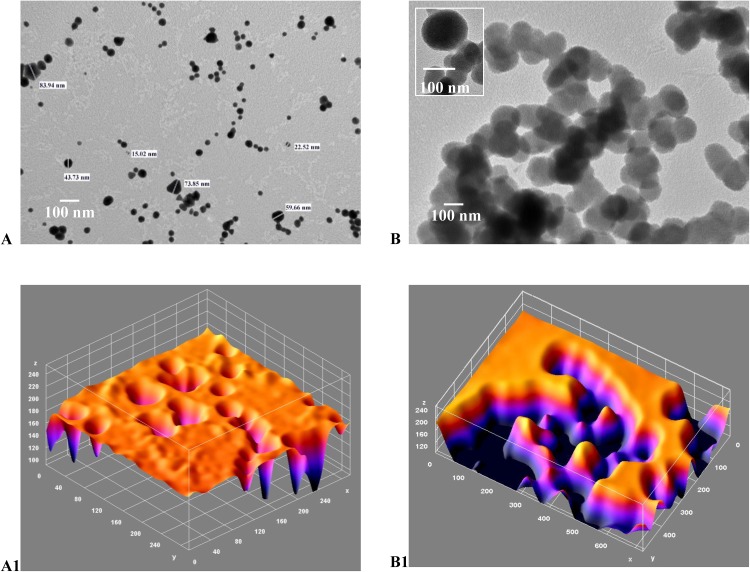
Figure 7.
(A-B1): TEM image and corresponding ImageJ analysis. (A) TEM for gold/chitosan NPs of various size and shape, size 160.3±36.17 (d, nm); (B) TEM image of EGCG/chitosan/TPP NPs, size 414.8±333.8 (d, nm); (A1) ImageJ for (A and B1) ImageJ for 7B with peaks denoting the intensity of the NPs in each case. Scale bars 300 nm.

