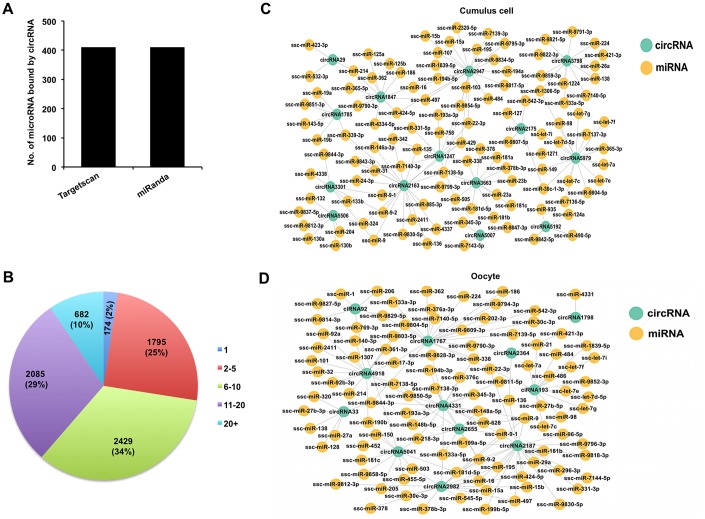
Figure 4.
Analysis of interaction between DECs and miRNAs in both cumulus cells and oocytes. (A) Analysis of number of miRNAs for circRNAs by Targetscan and miRanda. (B) Analysis of the proportion of circRNA processing different numbers of miRNA targets. (C) Analysis for predicted targeted miRNAs of the selected DECs identified in cumulus cells. The selected circRNAs were chosen from top DECs in cumulus cells. Blue circles represent circRNA, and yellow circles represent miRNA. (D) Analysis for predicted targeted miRNAs of the selected DECs identified in oocytes. The selected circRNAs were chosen from top DECs in oocytes. Blue circles represent circRNA, and yellow circles represent miRNA.

