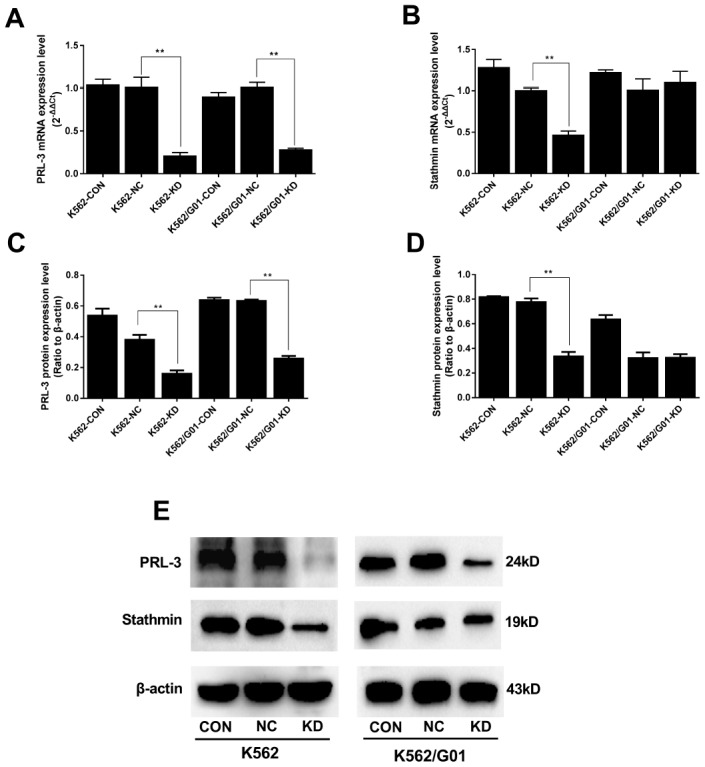
Figure 2.

Expression of PRL-3 and stathmin was assessed after PRL-3-silencing in K562 and K562/G01 cells. (A) The mRNA expression of PRL-3 after transfection. (B) The mRNA expression of stathmin after PRL-3-silencing. (C, D) Quantification of PRL-3 and stathmin were normalized to β-actin. (E) Western blot of PRL-3 and stathmin expression were detected after shPRL-3. (*P<0.05, **P<0.01, vs. NC group).
