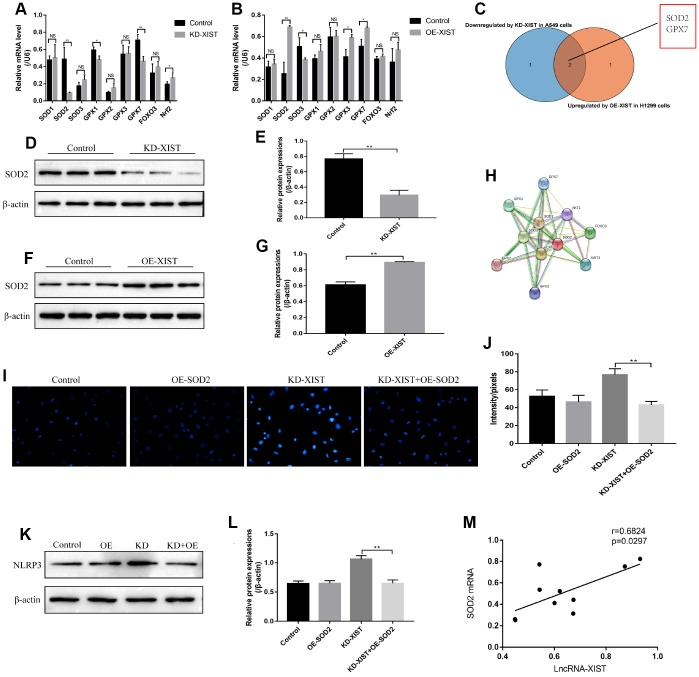
Figure 5.
The role of SOD2 in LncRNA-XIST regulated cell pyroptosis and ROS generation. (A) Real-Time qPCR was used to detect the levels of anti-oxidant genes in A549 cells. (B) Real-Time qPCR was used to detect the levels of anti-oxidant genes in H1299 cells. (C) Venn diagram showing the overlapped genes downreglated in A549 cells and upregulated in H1299 cells. Western Blot was used to detect SOD levels in (D) A549 cells and (F) H1299 cells, which were normalized to β-actin and (E, G) quantified by Image J software. (H) STRING software was used to conduct co-expression analysis of SOD2. (I, J) DHE staining was used to detect ROS levels in A549 cells. (K) NLRP3 levels were detected by Western Blot in A549 cells, which were normalized to β-actin and (L) quantified by Image J software. (M) Pearson analysis was conducted to analyse the correlation between LncRNA-XIST and SOD2 mRNA levels tin NSCLC tissues. (“NS” represented no statistical significance, “*” represented p < 0.05, “**” represented p < 0.01).

