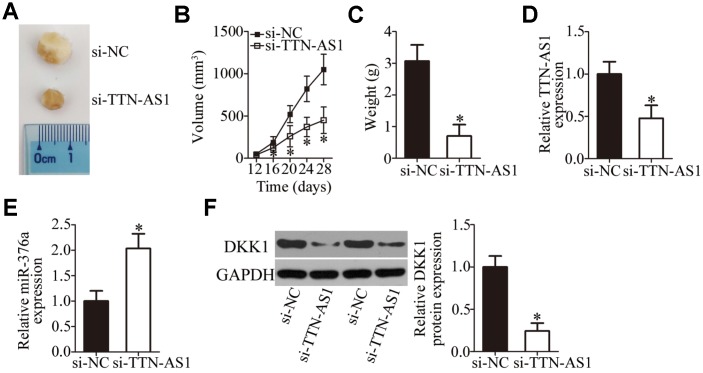
Figure 8.
TTN-AS1 downregulation restricts tumor growth of OS cells in vivo. (A) Representative images captured at 4 weeks after subcutaneous injection of si-TTN-AS1-transfected or si-NC-transfected HOS cells into the flank of nude mice. (B) Tumor growth curves show that tumors grew significantly more slowly in the si-TTN-AS1 group than in the si-NC group. *P < 0.05 vs. group si-NC. (C) The average weight of tumor xenografts collected in groups si-TTN-AS1 and si-NC was analyzed at 4 weeks after the inoculation. *P < 0.05 vs. the si-NC group. (D, E) The expression levels of TTN-AS1 and miR-376a in the tumor xenografts were measured by RT-qPCR. *P < 0.05 vs. group si-NC. (F) DKK1 protein expression was measured in the tumor xenografts by western blotting. *P < 0.05 vs. the si-NC group.

