Figure 3.
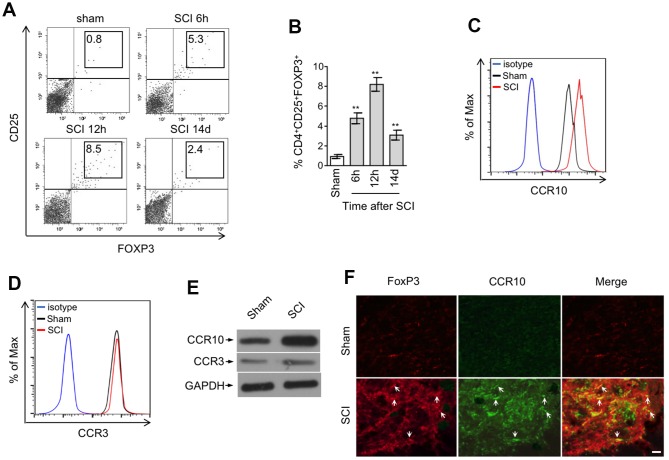
CCR10-expressing CD4+CD25+FOXP3+ Treg cells are enriched in the spinal cord after SCI. (A, B) Representative flow cytometry dot plots (A) and percentage (B) of CD4+CD25+FOXP3+ cells among the CD4+ T cells in the spinal cord after sham or SCI surgery. Cells were gated on 7-AAD negative population and the numbers inside plots refer to % Treg cells (n=5). (C, D) Representative histogram of CCR10 (C) and CCR3 (D) expression in CD4+CD25+FOXP3+ cells as gated in (A). (E) CD4+CD25+FOXP3+ cells in the spinal cord from sham and SCI mice were sorted out and analyzed by Western blotting to detect the expression of CCR10 and CCR3. GAPDH was used as a loading control. (F) Double immunostaining of FOXP3 (red) and CCR10 (green) in the spinal cord sections after sham or SCI surgery. The merged images are also shown. Arrows indicate cells with positive staining and colocalization. Scale bar, 100 μm. Data are mean ± SD. The statistical analysis was performed using Student’s t-test. **, P<0.01.

