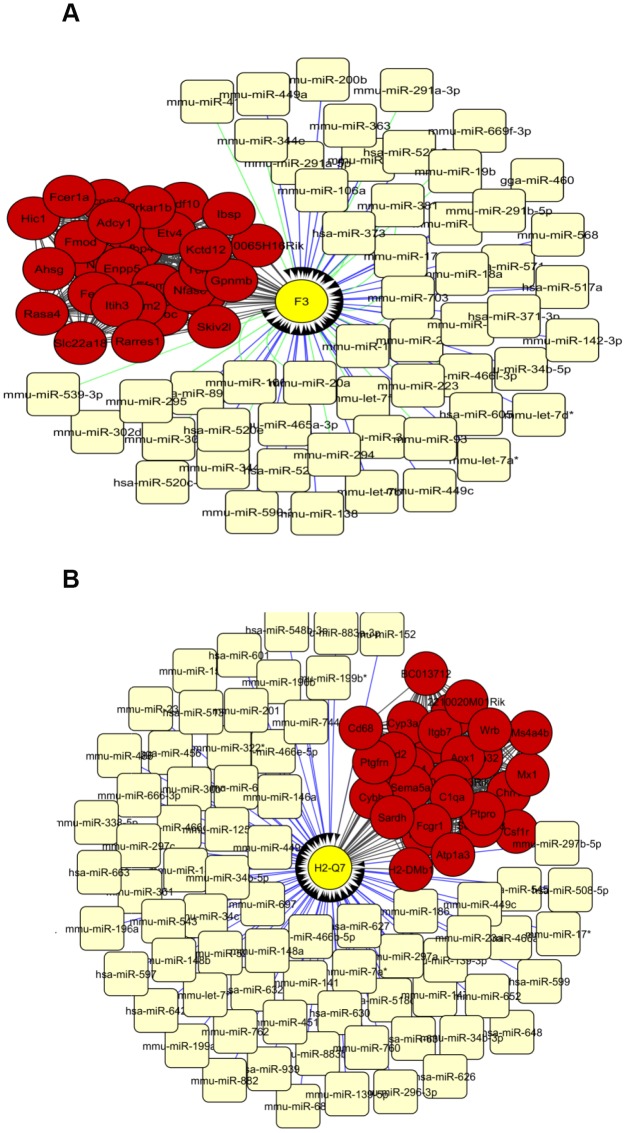
Figure 3.
The network of top 30 interconnected genes in the turquoise (A) and blue (B) modules and predicted miRNAs from TargetScan and Microcosm. The hub genes are shown in red and miRNAs in light yellow. mRNA-miRNA interactions from TargetScan and Microcosm are shown in green and blue lines respectively. Yellow circles show the genes that are putatively regulated by miRNAs.

