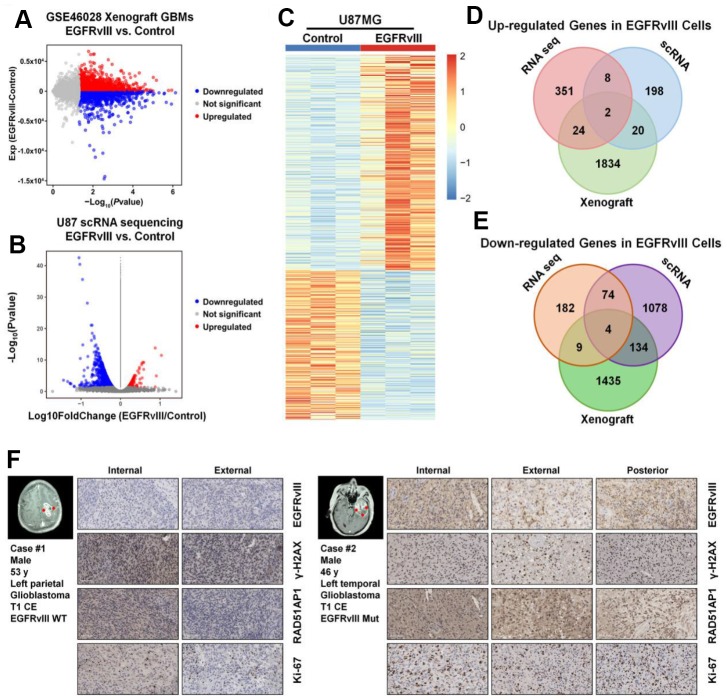
Figure 4.
RAD51AP1 is upregulated in EGFRvIII-positive cells. The volcano plot was constructed to profile the differentially expressed genes observed in GES46028 (A) and scRNA-seq data (B). (C) A heatmap was employed to profile the differentially expressed genes observed in U87MG/U87MG-EGFRvIII RNA-seq data. A Venn diagram was used to profile the common upregulated (D) and downregulated (E) genes in three databases. (F) The EGFRvIII, r-H2A.x, RAD51AP1 and Ki-67 expression levels in multipoint samples from two patients were examined by IHC staining.

