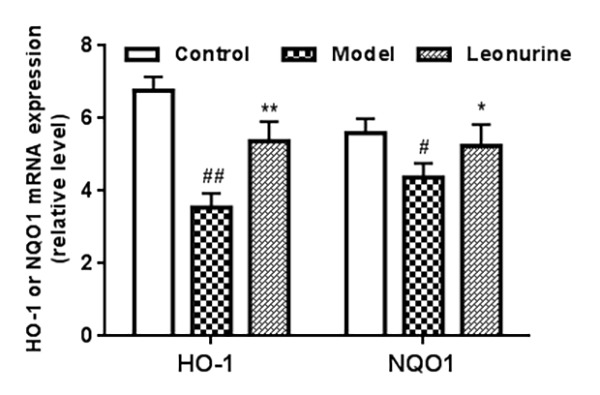
Figure 11.

The expression of HO-1 and NQO1 in different groups was analyzed through quantitative RT-PCR. Data are presented as mean±SD from each group (n=6, mean±SD). #P < 0.05 and ##P < 0.01 vs control group; *P < 0.05 and **P < 0.01 vs model group.
