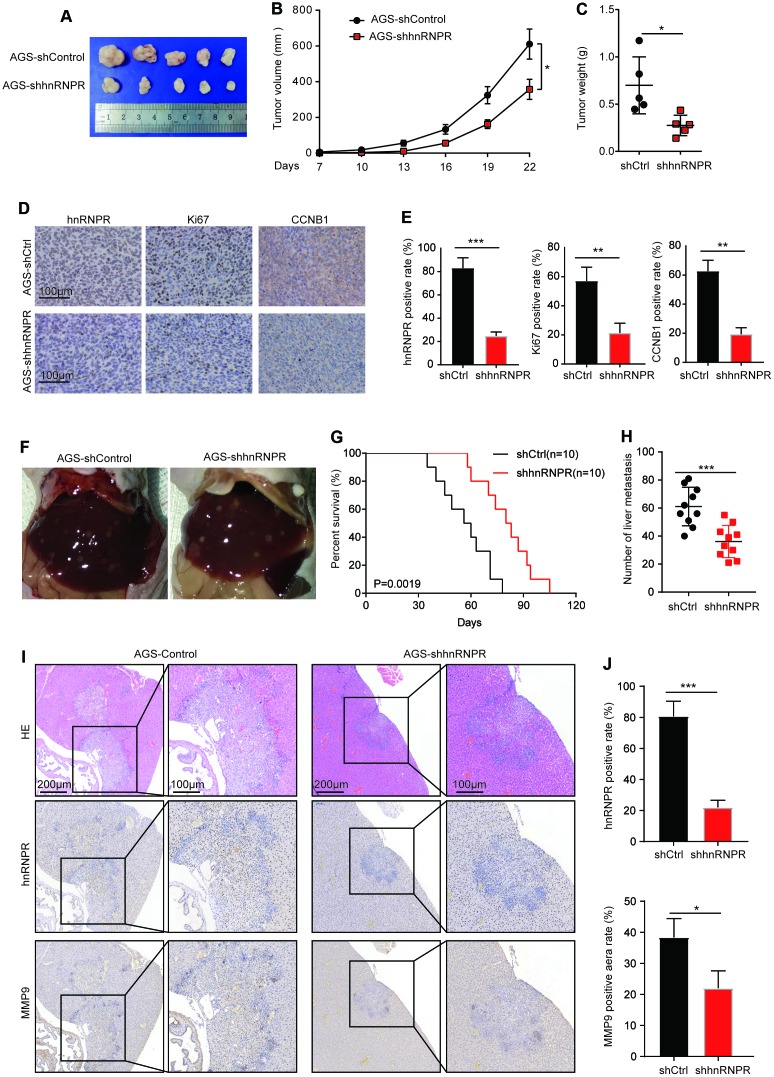
Figure 5.
Repression of hnRNPR inhibits tumor growth and metastasis in vivo. (A) Tumor size and (B) tumor volumes in hnRNPR-knockdown and control groups. (C) Tumor weight in hnRNPR-knockdown and control groups (n=5). (D) Representative images (E) quantification of hnRNPR, Ki67, and CCNB1 in the indicated xenograft tumors. (F) Representative images of liver metastasis in the indicated tumors. (G) Kaplan–Meier curve of mice showing low expression of hnRNPR versus high expression of hnRNPR group. (H) Number of liver metastasis (I) representative image (J) Quantification of hnRNPR and MMP9 expression in the indicated xenograft tumors. P values were calculated with two-tailed unpaired Student’s t-test, or log rank Mantel-Cox test. *, P<0.05, **, P<0.01.

