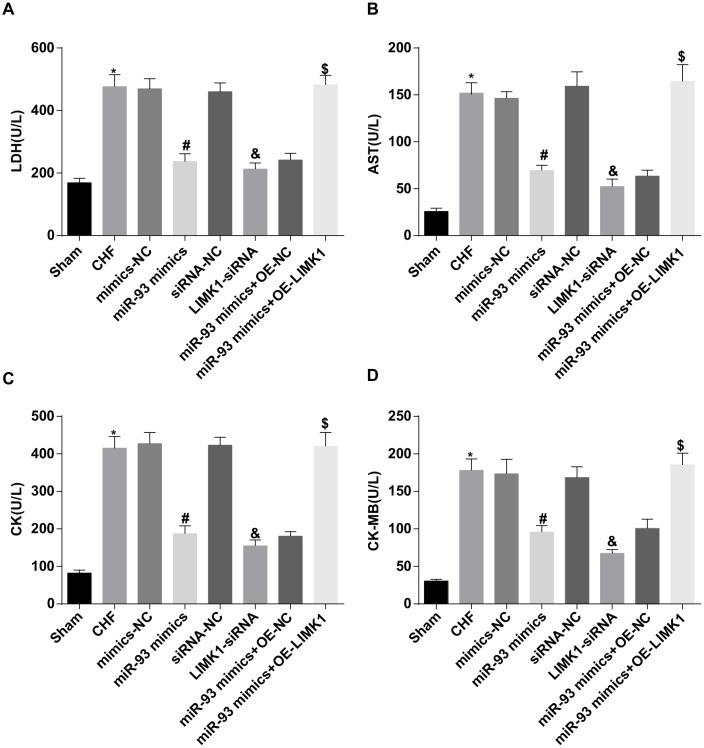
Figure 6.
LDH, AST, CK and CK-MB levels were inhibited by up-regulation of miR-93 or downregulation of LIMK1. (A) Comparison of plasma LDH content in each group of rats; (B) Comparison of plasma AST content in each group of rats; (C) Comparison of plasma CK content in each group of rats; (D) Comparison of CK-MB content in plasma of each group of rats; *P < 0.05 vs. the sham group; #P < 0.05 vs. the mimics-NC group; & P < 0.05 vs. the siRNA-NC group; $P < 0.05 vs. the miR-93 mimics + OE-NC group; N = 8, the data were showed as mean ± standard deviation; data analysis was performed by one-way ANOVA, and LSD-t method was used for pairwise comparison after ANOVA.

