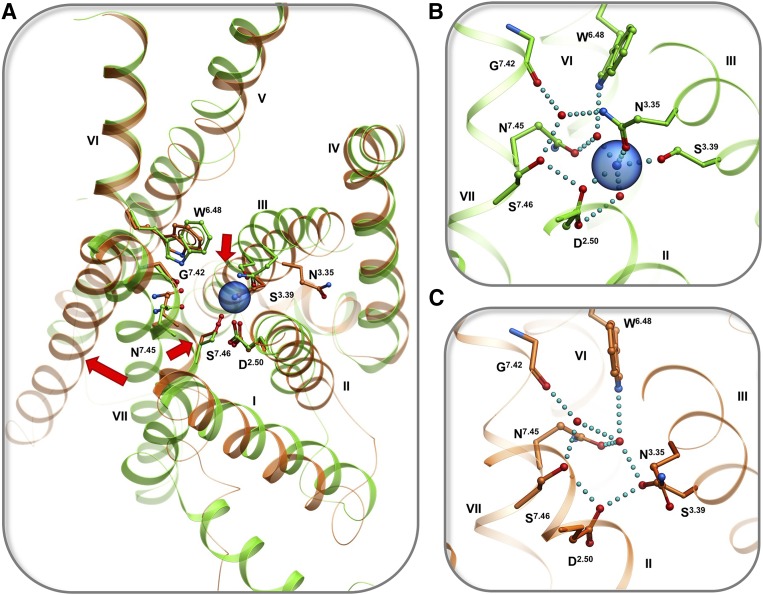
Fig. 3.
Conformational changes in the sodium pocket upon activation of opioid receptors. (A) Superimposition of high-resolution structures of δ-opioid receptor in inactive state (green, PDB: 4N6H, resolution 1.8 Å) and μ-opioid receptor in active state (orange, PDB: 5C1M, resolution 2.1 Å); conformational changes shown by arrows. (B) Close up of sodium pocket in inactive state. (C) Close up of the pocket in active state. Hydrogen bonds and salt bridges are shown by cyan dotted lines.

