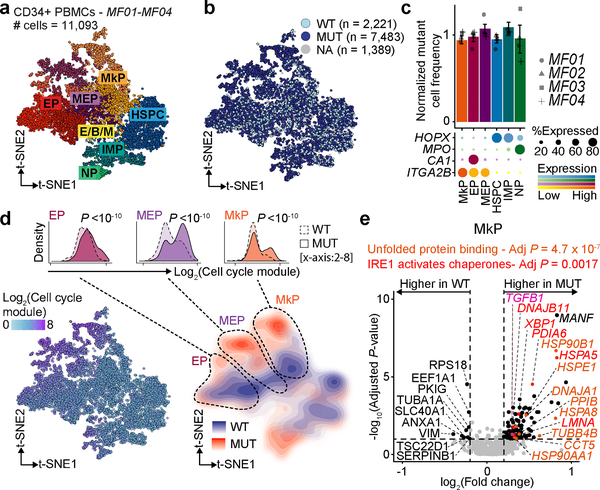
Figure 4. CALR mutation effects on hematopoietic progenitor cells from MF patients.
a, t-SNE projection of CD34+ cells from MF patients showing cluster assignment and b, genotyping data from GoT. c, Normalized frequency of mutant cells (Methods). Bar graphs represent aggregate analysis of MF01-MF04 showing mean ± SD of 100 downsampling iterations to 1 genotyping UMI; gray points represent mean of 100 down-sampling iterations for each sample. d, t-SNE projection of the CD34+ cells showing cell cycle gene expression (left) and density plot of mutant and wildtype cells (right). Density plots of mutant vs. wildtype cells along cell cycle gene expression (inset, Wilcoxon rank-sum test, two-sided; Supplementary Table 6). e, Differentially expressed genes in mutant vs. wildtype MkPs across samples MF01-MF04 (Supplementary Table 6). P-values combined using Fisher combine test with Benjamini-Hochberg adjustment. Key gene set enrichments (hypergeometic test, Methods).

