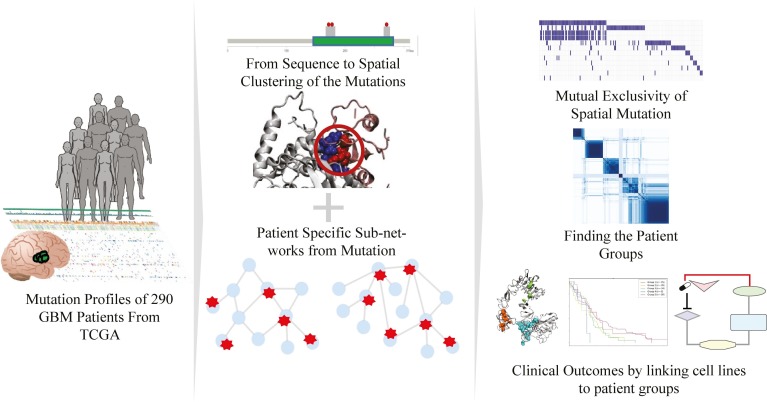
Fig 1. Overview of the method.
Patient specific GBM tumor mutation profiles were obtained from TCGA. The spatial proximity of each mutation is searched and mutation patches were obtained. Simultaneously, each cancer related driver protein having at least one mutation in each patient was used to reconstruct patient-specific sub-networks. Red dots and stars in the middle panel correspond to mutations mapped to the sequence, structure and PPI network. Finally, the sub-networks were used to classify the patients, to find signature patches in each patient groups and to demonstrate the help of 3D patches in overcoming heterogeneity. Lastly, we investigated the patient groups to find an association with the clinical outcome by using cell line drug sensitivity data. The brain and human icons in the first panel are retrieved from Reactome Icon Library [32].

