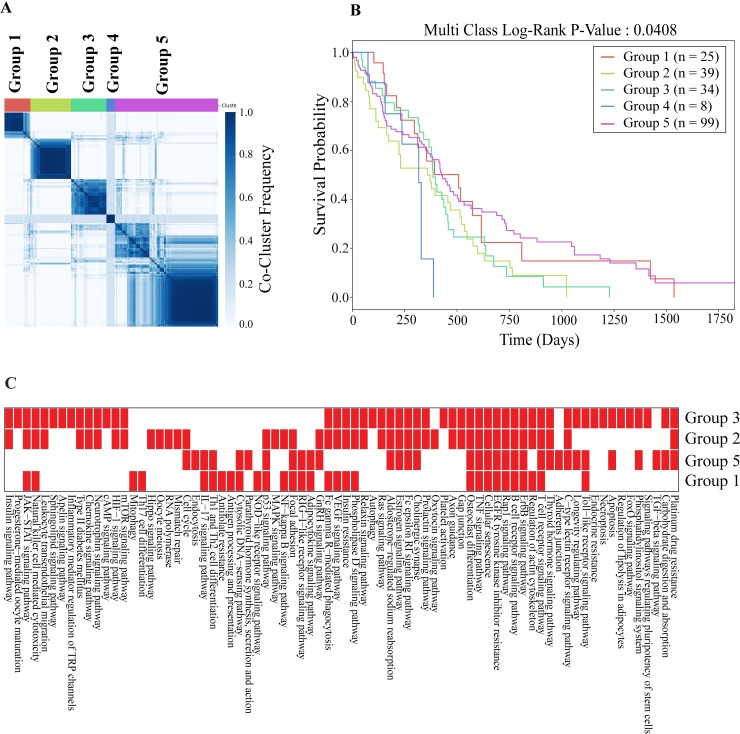
Fig 7. Clustering the tumors based on pathway similarities.
(A) Consensus clustering of the network inferred disease signatures. Each entry in the matrix shows the co-occurence of each pair of patients. (B) Kaplan-Meier survival plots of the patient groups. Each curve represents one group. (C) Enrichment of KEGG pathways across the patient groups. Reds indicate that KEGG pathways are mainly enriched in patients of specific groups except Group 4 which does not have any KEGG pathway dominantly enriched in its patients.

