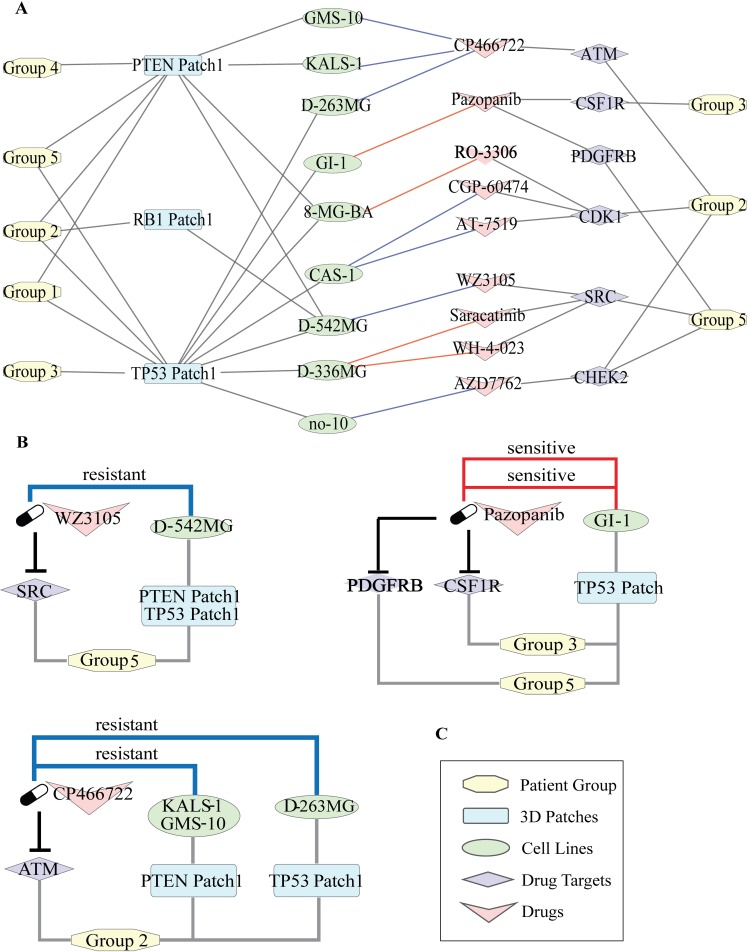
Fig 8. Linking the network-guided patient groups to drug treatments through 3D spatial patches.
(A) Nodes represent group identifiers, patch names, cell line names, drugs and their targets, respectively. Edges between group Ids and patch names imply the presence of the presence of the corresponding patch in the group. Edges between patch names and cell line Ids represent that at least one mutation in the corresponding patch is present in the connected cell line. Edges between cell lines and drug names imply that the cell line is treated with the corresponding drug. If the cell line is sensitive to the drug then the edge color is red, if resistant the edge color is blue. Edges between drugs and target proteins are to show that proteins targeted by the corresponding drugs that are significantly present in the linked group. (B,C,D) Three submodules are retrieved from the network to show some therapeutic hypotheses where the first one is Pazopanib (targeting CSF1R and PDGFRB) for Group 5, the second is the possible resistance of Group 2 to ATM inhibition and the last one is WZ3105 (targeting SRC) for Group 5.

