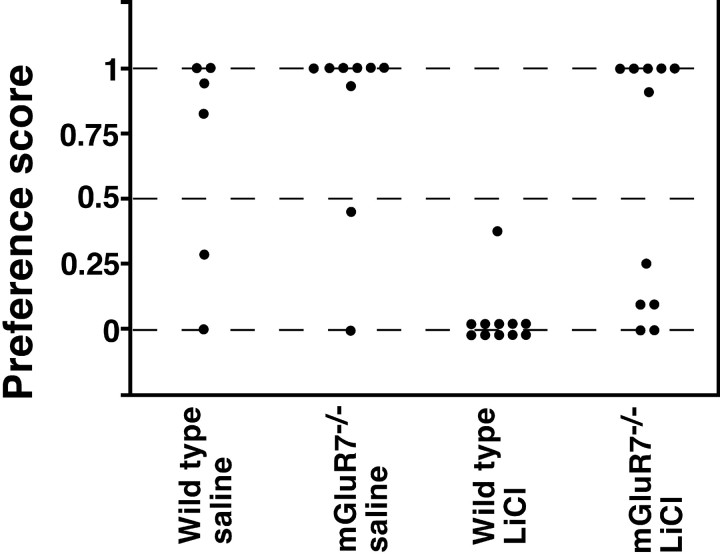
Fig. 7.
Performance of CTA. The data are expressed as relative ratios in the amount of drinking saccharin (milliliters)/water and saccharin (milliliters), using the two-bottle choice procedure as described in Materials and Methods. Each data point represents the result determined for one mouse. There was no difference in the preference of drinking saccharin between wild-type and mGluR7−/− knockout mice when saline was injected into these mice (wild-type vs mGluR7−/−:U = 18.5, p = 0.28). LiCl injection into wild-type mice resulted in a marked aversion to saccharin (wild-type, saline vs wild-type, LiCl: U= 7, p = 0.0022). In mGluR7−/−knockout mice, CTA memory was markedly reduced (wild-type, LiCl vs mGluR7−/−, LiCl: U = 15,p = 0.001). Statistical analysis was performed using the Mann–Whitney test.

