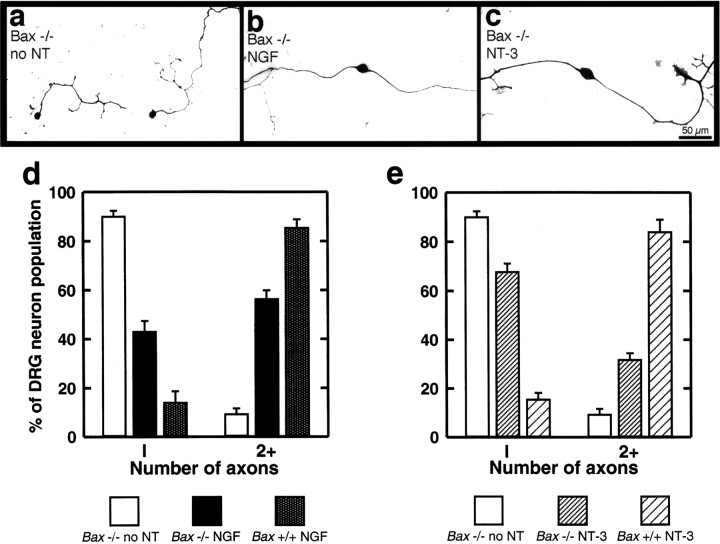
Fig. 2.
Quantification of neurotrophin responses.a–c, Photomicrographs show the typical pattern of axon extension from representative Bax−/− neurons grown for 72 hr in vitro without neurotrophins (a) or in the presence of 50 ng/mlNGF (b) or NT-3(c). d, e, Bar graphs show the percentage of neurons (± SEM) with one or two or more axons from Bax−/− mice and Bax+/+ littermates. Under these culture conditions, almost all neurons fromBax+/+ mice in the presence of either NGFor NT-3 were bipolar (stippled bar ind and wide-hatched bar ine, respectively). In contrast, in the absence of added neurotrophins (no NT), 90% ofBax−/− neurons were unipolar (open barsin d, e). Addition of eitherNGF (solid bars in d) orNT-3 (fine-hatched bars in e) resulted in a substantial fraction ofBax−/− neurons having two or more axons. Differences in percentages of neurons with a single axon between the no neurotrophin group and the groups treated with NGF orNT-3 were highly significant (p < 0.001; n = 6 embryos per group).

