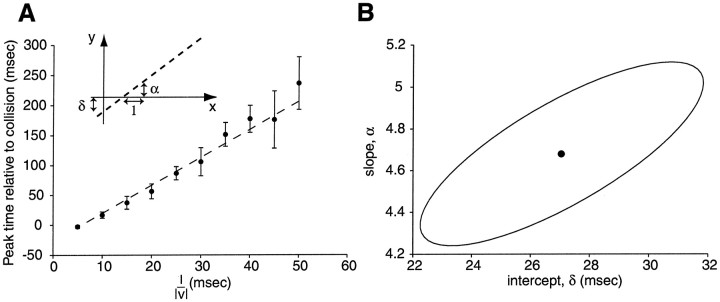
Fig. 4.
Relation between the time of peak firing rate and l/‖v‖ is linear. A, Plot of the time of peak firing rate, ‖tpeak‖, obtained from Figure 3as a function of l/‖v‖ (mean ± SD). Note the increase in SD as l/‖v‖ increases (visual inspection of the rasters and firing rate estimates in Fig. 3 shows a clear tightening of the responses for small values of l/‖v‖). This increase in SD with l/‖v‖ was observed in all preparations. Dashed line, Best least square fit of the data to Equation 5 (α = 4.7 ± 0.3; δ = 27 ± 3 msec).Inset, Schematics illustrating the geometric significance of δ (intercept of the y -axis and the dashed line) and α (slope). B, Two-dimensional plot of the estimated value of α and δ together with the 68.3% confidence region for these parameters. This confidence region is an ellipsetilted from the horizontal, reflecting the fact that the estimates in these parameters are well correlated (correlation coefficient, 0.76). In other words, if α were overestimated, then δ would also be expected to be overestimated and vice versa. Conversely, if α were underestimated, then δ would also be expected to be underestimated and vice versa. Significance level of the Kolmogorov–Smirnov test: p ≥ 0.80.

