
Fig. 5.
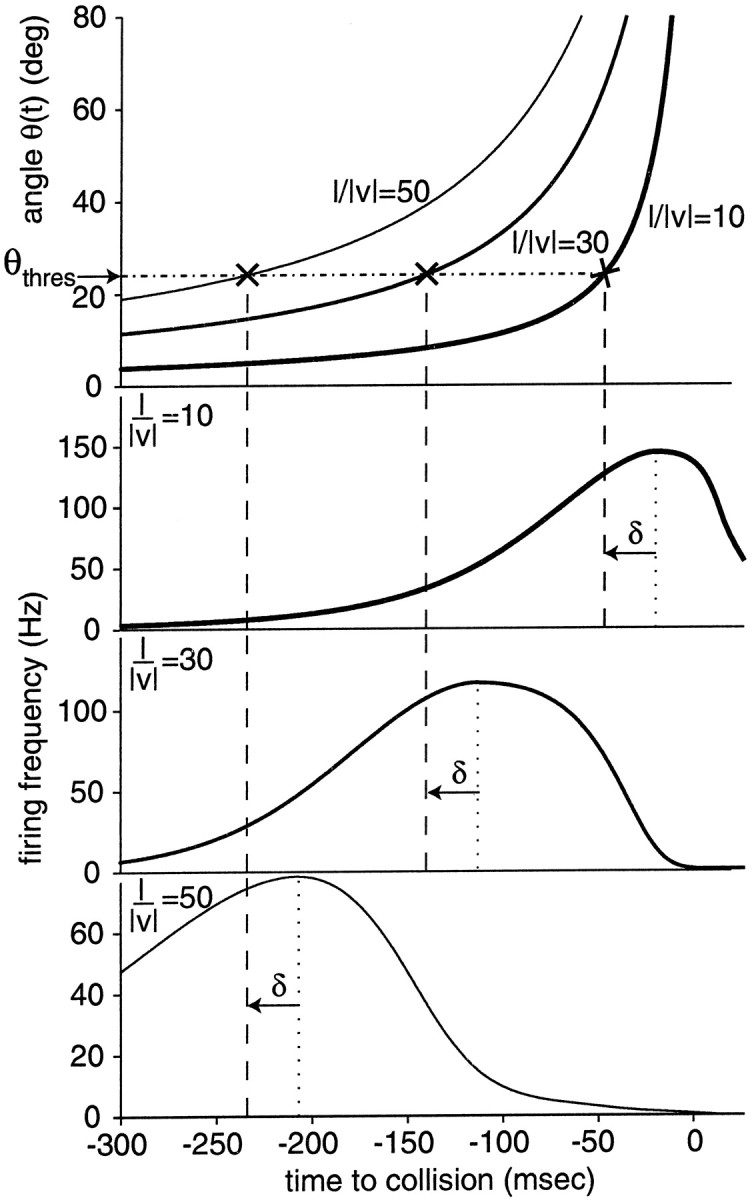
Diagram illustrating the significance of Equation5 for the time course of the DCMD response to looming objects.Top panel, Angle of an approaching square for three different values of l/‖v‖ (10, 30, and 50 msec; Eq. 2).Bottom three panels, Time course of DCMD firing rate in response to these stimuli. The time of peak firing follows the same linear relation (Eq. 5) observed in Figs. 3 and 4. In each case, the time of peak firing is indicated by the dotted vertical lines. The three vertical dashed lines are placed δ = 27 msec before the peak. At this moment the angle subtended by the object is θ(t) = 24° for all three experiments. [Eachvertical dashed line intersects its angular size stimulus curve (×) at a constant y = θthres = 24°.]