
Fig. 3.
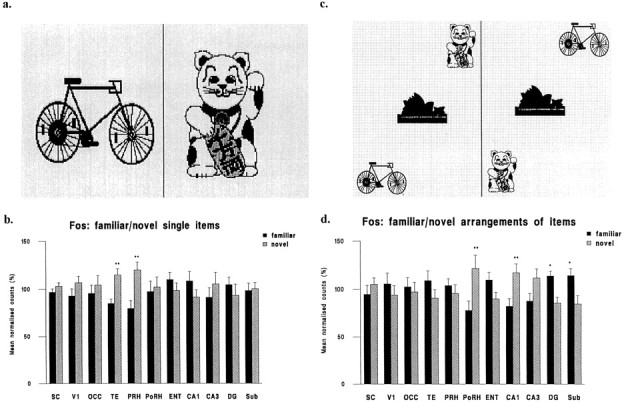
Example pictures and normalized counts in the brain regions sampled for novel and familiar individual items and arrangements of items. a, Two example pictures of single items (items were colored but are illustrated in monochrome).b, Normalized counts of Fos-stained nuclei in the sampled brain regions for novel and familiar pictures of single items. An ANOVA of the normalized counts revealed a significant interaction between area and novelty/familiarity (F(10,360) = 2.18; p < 0.02). Further analysis revealed that the mean counts were higher for novel than for familiar objects in areas TE and PRH (eachp < 0.01), but no other differences reached significance. c, Two example pictures of arrangements of items: note the different arrangements of the same items.d, Normalized counts of Fos-stained nuclei in the sampled brain regions for novel and familiar pictures of arrangements of items. An ANOVA of the normalized counts revealed a significant interaction between area and novelty/familiarity (F(10,306) = 5.69; p < 0.001). Further analysis revealed that the mean counts were higher for novel than for familiar arrangements in areas PoRH and CA1 (eachp < 0.01) and higher for familiar than for novel arrangements in areas DG and Sub (each p < 0.05). No other differences reached significance. Although the size of each individual stimulus was larger in experiment 1 than experiment 2, the percentage differences in activation for novel and familiar stimuli are comparable to those found using objects that subtend approximately half the visual angle of these stimuli (Zhu et al., 1996). Accordingly, the size of the individual items is not critical to the results obtained over the range of sizes explored. Novel versus familiar differences: *p < 0.05; **p < 0.01. See Figure 2 for abbreviations.