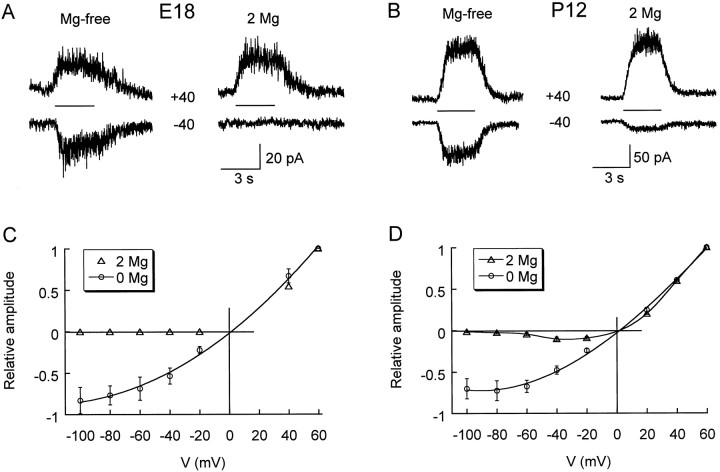
Fig. 5.
Magnesium dependence of current–voltage relationships for NMDA responses in prenatal and postnatal CR cells.A, B, Representative traces obtained with CsCl pipettes at symmetrical voltages (± 40 mV), as indicated. NMDA (100 μm) was applied for 3 sec, as shown by the bars between the traces. Glycine (10 μm) was present in both Mg2+-free and 2 mmMg2+ conditions. C, D, Current amplitude was normalized to values obtained at +60 mV and is plotted against the holding potential (V).

