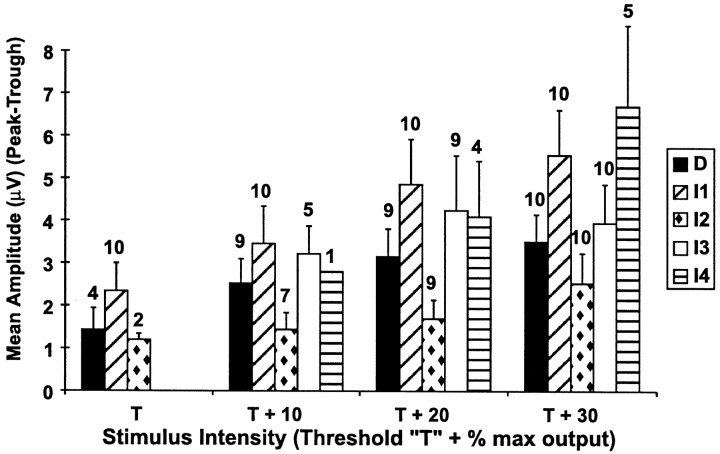
Fig. 4.
The effect of TCMS intensity on the amplitude of the D and I waves recorded from an epidural electrode at Th8. The amplitude of each wave was measured from its negative peak to the following positive trough (peak-to-trough). Each bar represents the mean amplitude of each wave, and the error bars represent the SEM. The number above each bar is the number of subjects in the sample. The I1 wave was recruited at spinal cord-evoked potential T in all 10 subjects, and theD wave was concomitantly recruited withI1 in 4 of these. At T + 10% the D wave was recruited in 9 of 10 subjects.

