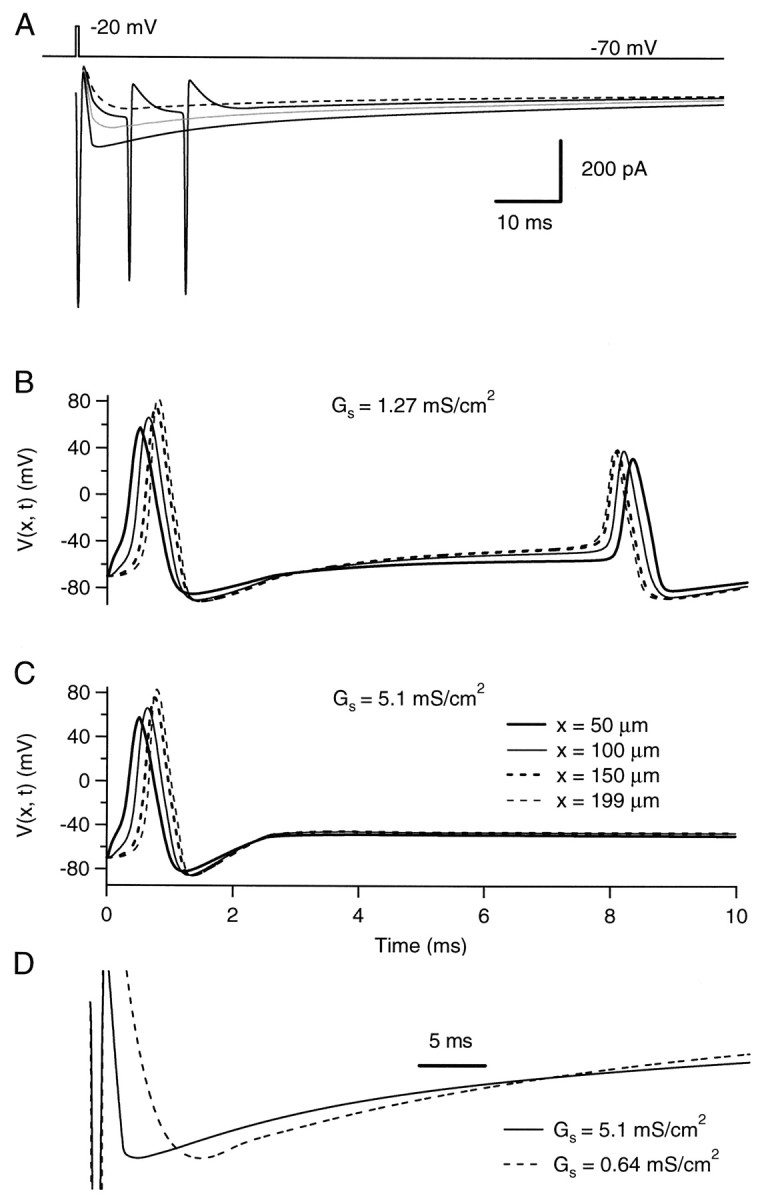
Fig. 11.

Axon-like cable with homogeneous autoreceptor current input. Simulations of a cable 200 μm long with a radius of 0.25 μm. The parameters describing the passive electrical properties of the cable are as in Figure 10. The cable has a uniform Na+ conductance density (50 mS/cm2 with a reversal potential at +90 mV) and a uniform K+ conductance density (400 mS/cm2 with a reversal potential at −95 mV). The kinetic parameters of these conductances are given in Materials and Methods. Results of simulations are displayed with different uniform autoreceptor conductance densities. The kinetic parameters and reversal potential of the autoreceptor conductance are the same as in Figure 10. A, Currents elicited by a short voltage pulse (duration, 0.5 msec; amplitude, 50 mV) at the origin of the cable. Traces are “leak-subtracted” (see Materials and Methods). The autoreceptor conductance is activated 1 msec after the beginning of the pulse. Autoreceptor densities of 0.64 mS/cm2 (dashed trace), 1.27 mS/cm2 (continuous trace with the two secondary spikes), 2.55 mS/cm2 (gray trace), and 5.1 mS/cm2 (continuous trace without secondary spikes) are represented. B, C, Voltage time courses at four different locations along the cable with two different autoreceptor conductance densities: 1.27 mS/cm2 for B and 5.1 mS/cm2 for C. Here only 10 msec are shown. The first spike is the one evoked by the voltage pulse at the origin. The second, antidromic spike in B corresponds to the first of the two secondary spikes in A. D, Peak-scaled traces corresponding to autoreceptor conductance density values of 0.64 mS/cm2(dashed line) and 5.1 mS/cm2(continuous line). Times to peak are, respectively, 8.4 and 3.6 msec, and half-decay times are 25 and 28 msec. Calibration, 5 msec.
