Fig. 4.
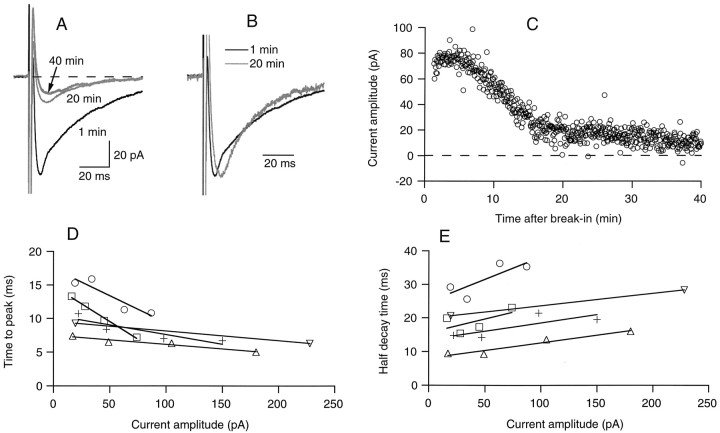
The delayed current transient fades during prolonged whole-cell recording. A, Mean delayed current transient at three distinct periods of whole-cell recording, showing a marked decay during the initial 20 min period, followed by a stabilization at a low level (gray traces). B, Superimposed normalized traces at 1 and 20 min of whole-cell recording, showing that the reduction of amplitude with time is accompanied by a lengthening of the time to peak and a decrease of the time of decay. C, Kinetics of washout, from the same data (stimulation frequency, 0.25 Hz; series resistance during recording, 14 MΩ). D, E, Relation of time to peak (D, measured from the onset of the voltage pulse) and half decay time (E) on peak current amplitude. Data are from four cells as the one illustrated in A and B, and from a fifth cell in which the current was inhibited by addition of bicuculline. Each data point corresponds to averages of ∼10–20 traces with homogeneous amplitudes. Results for individual cells are indicated by specific symbols and have been fitted by individual regression lines. Note that the slopes of the regression lines are all negative in D and positive in E.

