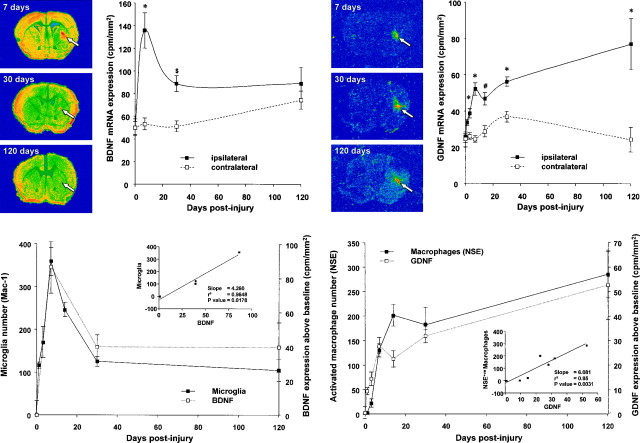
Fig. 2.
Middle. Line graphs showing the changing number of MAC-1-positive macrophages, NSE-positive macrophages, and MAC-1-positive microglia in groups of four mice at 0, 1, 3, 7, 14, 30, and 120 d after striatal injury. All values are the mean number of cells in five representative sections through the wound (1 section through the middle of the wound and 2 sections either side). Error bars indicate SEM.

