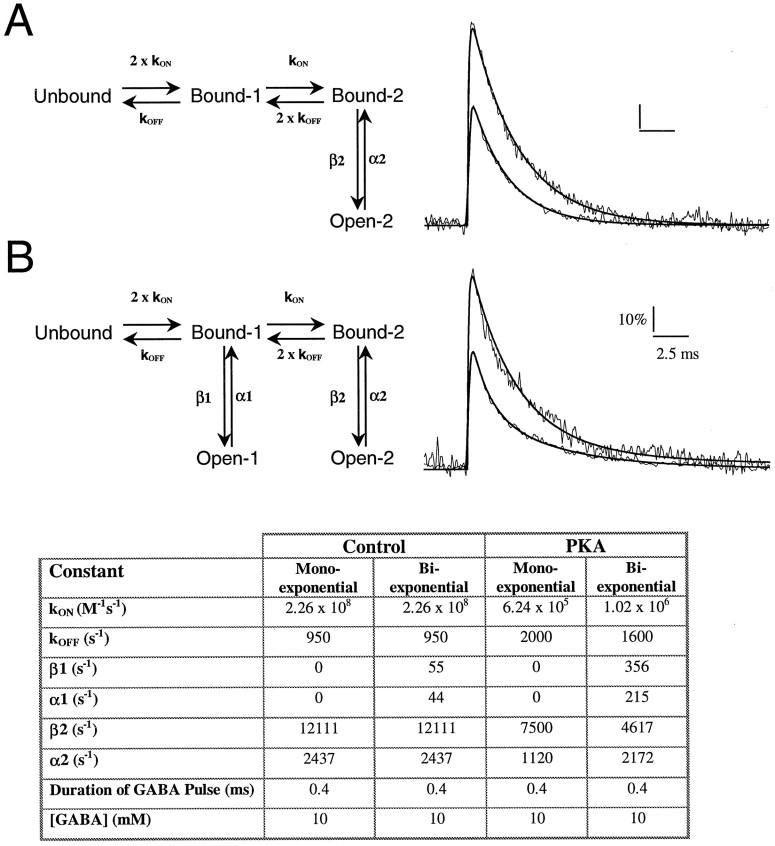
Fig. 3.
Modeling of monoexponentially and biexponentially decaying mIPSCs. Monoexponentially (A) and biexponentially (B) decaying events were simulated using the models depicted in the left panels(one or two open state). Right panels show the results of simulations with the fitted curves superimposed over the averages of 25 mIPSCs. The y-axis represents open probability, with data normalized to a popen of 0.85 at the peak of the mIPSC. The table gives the parameters used to simulate the various events.

