
Fig. 4.
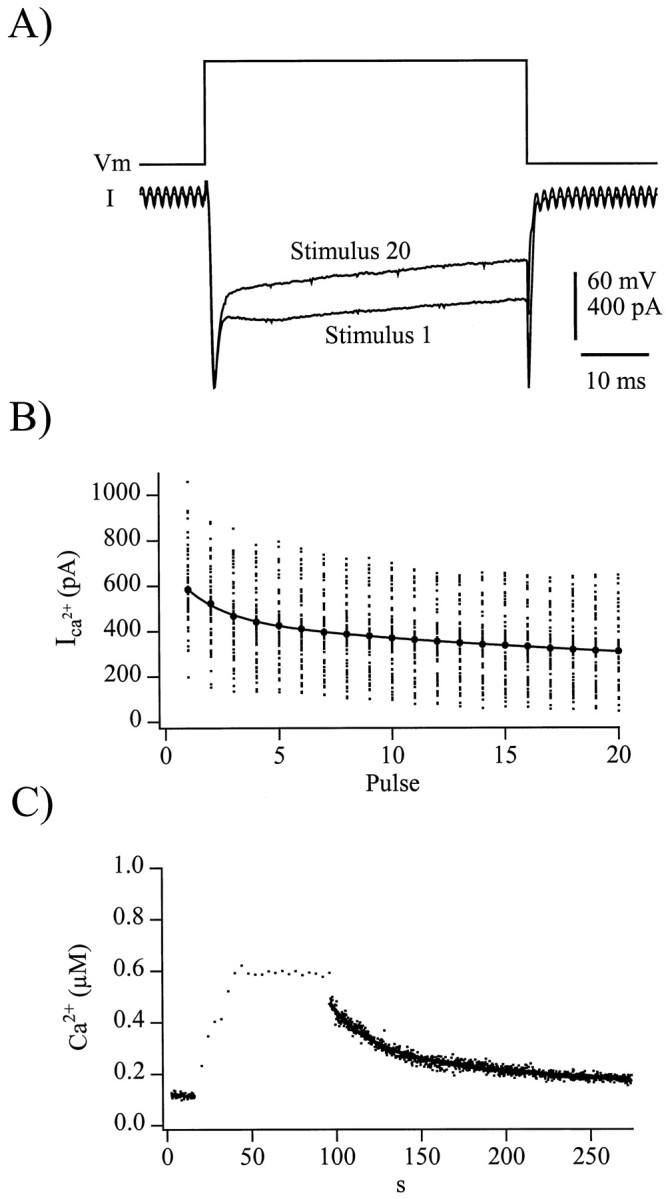
Ca2+ clearance is slowed after the train stimulation protocol. A, Voltage protocol (top trace) and representative evoked currents (bottom traces) from the first and last depolarization of a train are shown. B, Average evoked Ca2+ currents measured during each depolarization of a train stimuli from 38 individual cells is plotted against the pulse number (small dots). Only data from the first trains are included to avoid effects of Ca2+-dependent inhibition of calcium influx observed in the second trains of paired train stimulation protocols. For clarity, the current magnitudes from each pulse were averaged and overlay the individual points (large dots). The decay in current amplitude was fitted as a double exponential decay, resulting in time constants of 8.5 and 117.0 sec (Table 1, Caτ2 and Caτ3) with magnitude of 137 and 253 pA, respectively. C, [Ca+2]i measured in fura-AM ester-loaded chromaffin cells after train depolarizations shows a slowed clearance of Ca2+. A Ca2+record from a representative cell is displayed, and the post-train [Ca2+]i decay is fitted with a double exponential decay, with time constants of 22 and 77 sec (Table 1, Caτ4 and Caτ5), each of 250 nm in magnitude.