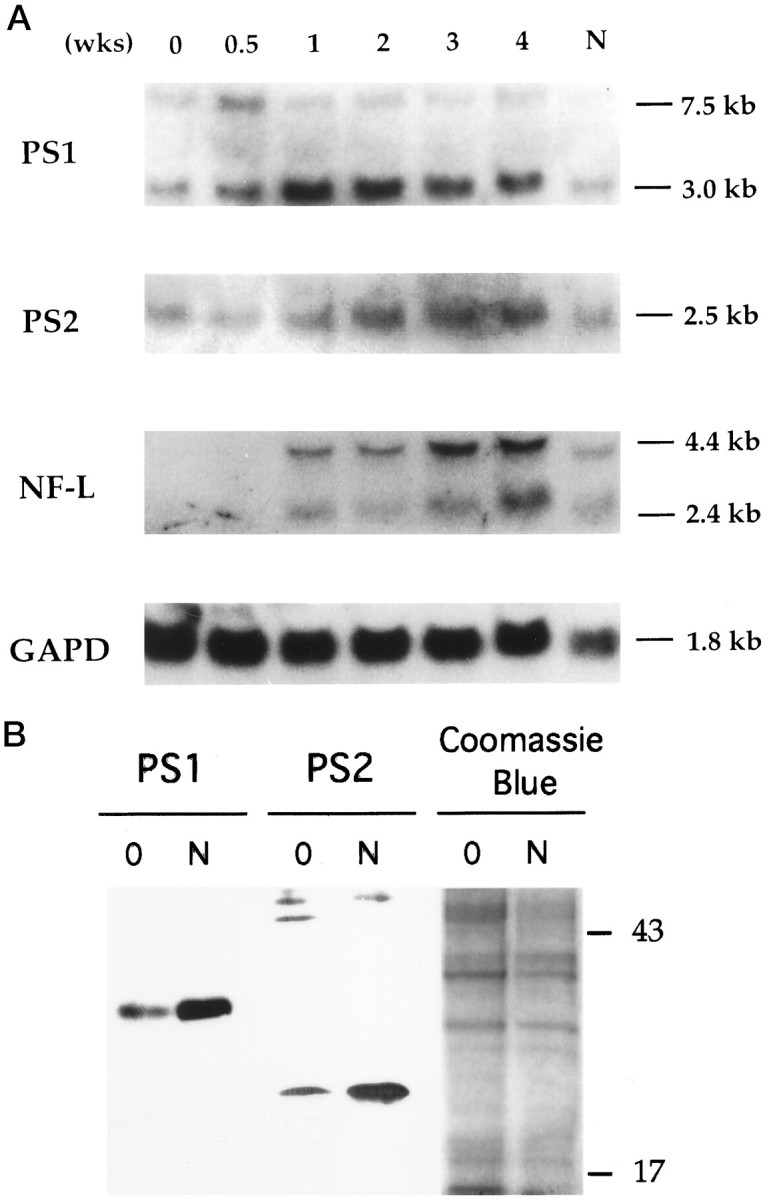
Fig. 2.

Presenilin gene expression during neuronal differentiation of NT2 cells. A, Total RNAs were isolated from NT2 cell cultures staged with RA treatment (top, 0–4 weeks and N after isolation of >95% pure neurons). After transfer to nylon membrane, the Northern blot analysis was sequentially performed with cDNA probes of PS1, PS2, NF-L, and glyceraldehyde-3-phosphate dehydrogenase (GAPD) as control for RNA loading. PS1 probe recognized a major transcript of 3.0 kb and a minor transcript of 7.0 kb (Sherrington et al., 1995). NF-L probe detected two transcripts of 2.4 and 4.4 kb (Pleasure and Lee, 1993). B, Immunoblotting analysis of PS1 and PS2 expression in NT2 cells. Equal amounts of total protein from lysates of uninduced NT2 cells (0) or isolated neurons after RA induction (N) were separated by SDS-PAGE and blotted with PS1 and PS2 monoclonal antibodies. The PS1 N-terminal proteolytic fragment (∼28 kDa) is significantly higher in neuronally differentiated NT2 (N) cultures than in the uninduced NT2 cells. Expression of the PS2 C-terminal proteolytic fragment (∼20 kDa) is similarly increased in the neuronally differentiated cultures. The respective PS1 and PS2 full-length proteins were not detected in any NT2 cell lysates (see Fig. 4). The ∼43–50 kDa bands in the PS2 immunoblot are nonspecific bands. Right panel, Coomassie blue staining of a duplicate gel run in parallel is shown for control of sample loading.
