
Fig. 2.
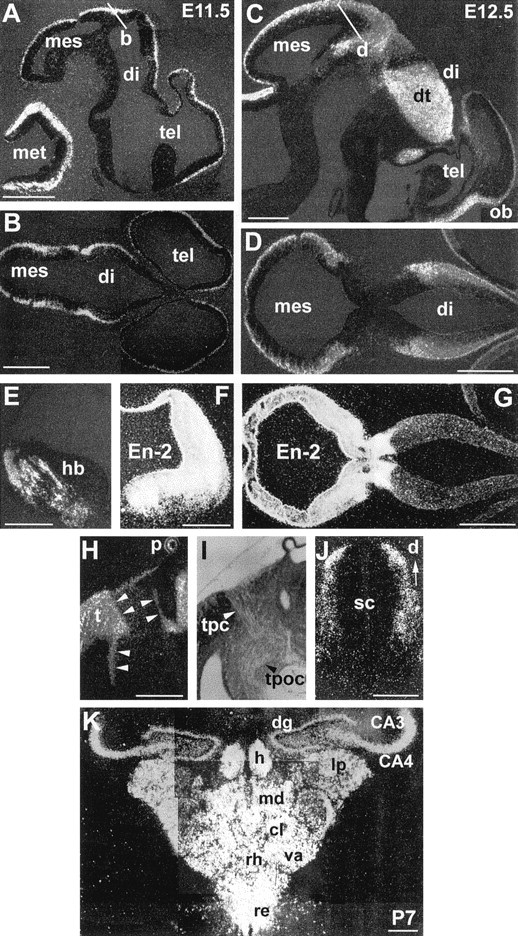
Lhx9 expression on brain sections from E11.5 (A, B), E12.5 (C–E, J), E13.5 (H, I), and P7 (K) embryos and comparison withEn-2 (F, G) on dark-field illumination photomicrographs. In this and subsequent figures, pictures are oriented so that anterior is right and dorsal is at thetop. A, C, Parasagittal sections through the entire brain at indicated stages. B, D, Horizontal sections (level and orientation indicated by white barsin A, C, respectively). G,En-2 expression on a section adjacent to that shown inD. E, F, Adjacent coronal hemisections showing the comparison of Lhx9 (E) and En-2 (F) expression in the anterior hindbrain. H, I, Bright-field (I) and dark-field (H) views of the same area showing the correlation between the position of the tpc and the tract of the postoptic commissure (tpoc) and Lhx9sharp boundaries of expression (arrowheads).J, Coronal section through the spinal cord.K, Coronal section at the level of the hippocampus and thalamus at P7, showing expression in CA3, CA4, and the dentate gyrus (dg) and the delineation of various thalamic nuclei by Lhx9 hybridization signal. cl, Central lateral; hr, habenula; lp, lateral posterior; md, mediodorsal; va, ventral anterior; re, reuniens; rh, rhomboid. See Table 1 for anatomical abbreviations. Scale bars:A–I, K, 100 μm; J, 50 μm.