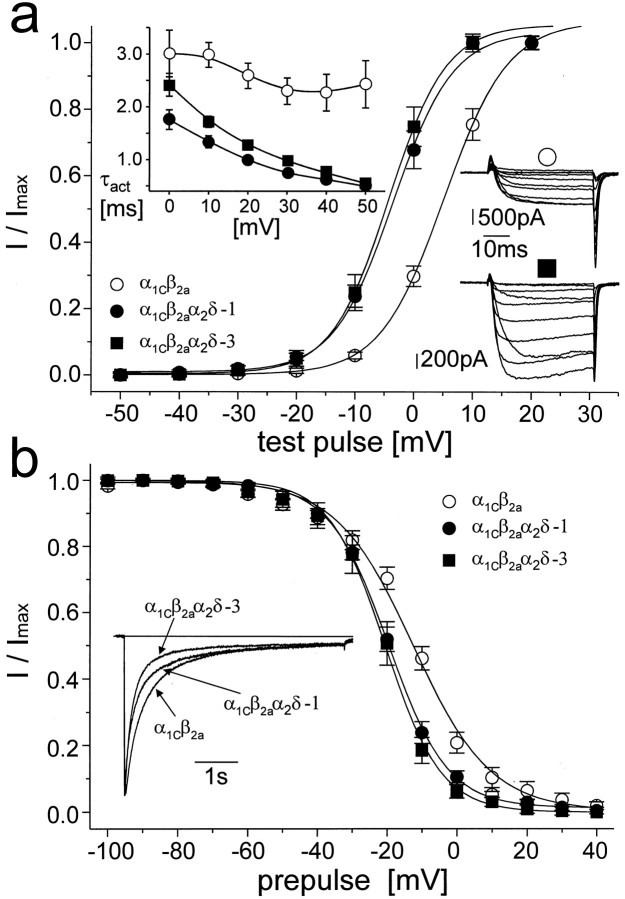
Fig. 4.
The α2δ subunit affects current through the α1C-type calcium channel. The α2δ-3 subunit was coexpressed with α1C and β2a. For comparison, the current through cells coexpressing α2δ-1 subunit was coanalyzed.a shows the voltage dependence of current activation measured as the amplitude of current activated by a 40-msec-long depolarizing pulse from a holding potential of −80 mV to voltages marked on the ordinate and normalized to the maximal amplitude. Each voltage dependence was fitted to the Boltzmann equation. Results of these fits are summarized in Table 1. The inset in thetop left of a shows voltage dependence of the kinetics of current activation. The ascending phase of the current time course was fitted to single exponential. The resulting time constants were averaged and plotted against corresponding membrane potentials. In both graphs, ○ represents the α1Cβ2a channel, • the α1Cβ2aα2δ-1 channel, and ▪ the α1Cβ2aα2δ-3 channel. Theinset in the right of aillustrates a typical family of currents measured during a series of depolarizing pulses from the holding potential of −80 mV to membrane potentials ranging from −20 to +70 mV with a step of +10 mV. ○, α1Cβ2a channel. The cell capacity was 83 pF, and the resulting maximal current density was approximately −13 pA/pF; ▪, α1Cβ2aα2δ-3. The cell capacity was 31 pF, and the corresponding maximal current density was approximately −41 pA/pF. b shows averaged steady-state inactivation curves measured from a holding potential of −80 mV. Current was inactivated by a 5-sec-long prepulse to the potentials marked on the ordinate. This was followed by a 5-msec-long return to the holding potential and a 40-msec-long test pulse to the maximum of the current–voltage relationship. Solid lines are fitted to the Boltzmann equation. The inset shows the time course of the current during a 5-sec-long depolarizing pulse to +20 mV with zero level indicated by a horizontal line. Currents shown are averaged time courses from 9 to 12 experiments scaled to the same amplitude. Individual measurements were fitted to the sum of two exponentials. Results of all fitting procedures are summarized in Table1. Symbols are as in a.

