
Fig. 2.
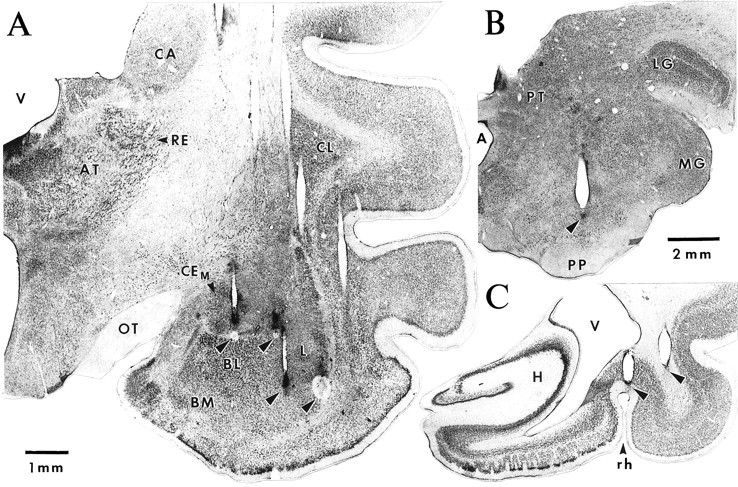
Histological determination of recording and stimulating sites. A, Frontal section showing the traces left by one row of microelectrodes. Note that the plane of the section is not exactly parallel to the trajectory of the microelectrodes. For some electrodes, the last recording site was marked with small electrolytic lesions (arrowheads). Leftto Right, Arrowheads point to electrolytic lesions performed at the end of tracks through the CEM, CEL, and lateral (tworightmost lesions) nuclei. B,C, Photomicrographs in which arrowheadspoint to the traces left by the tip of stimulating electrodes just dorsal to the substantia nigra (B) and in the perirhinal region (C). A, Aqueduct; AT, anterior thalamic nuclei;BL, basolateral nucleus; BM, basomedial nucleus; CA, caudate nucleus;CEM, medial sector of the central nucleus;CL, claustrum; H, hippocampal formation;L, lateral nucleus; LG, lateral geniculate nucleus; MG, medial geniculate nucleus;OT, optic tract; PP, pes pedunculi;PT, pretectal nuclei; PU, putamen;RE, reticular thalamic nucleus; rh, rhinal sulcus; V, ventricle.