
Fig. 6.
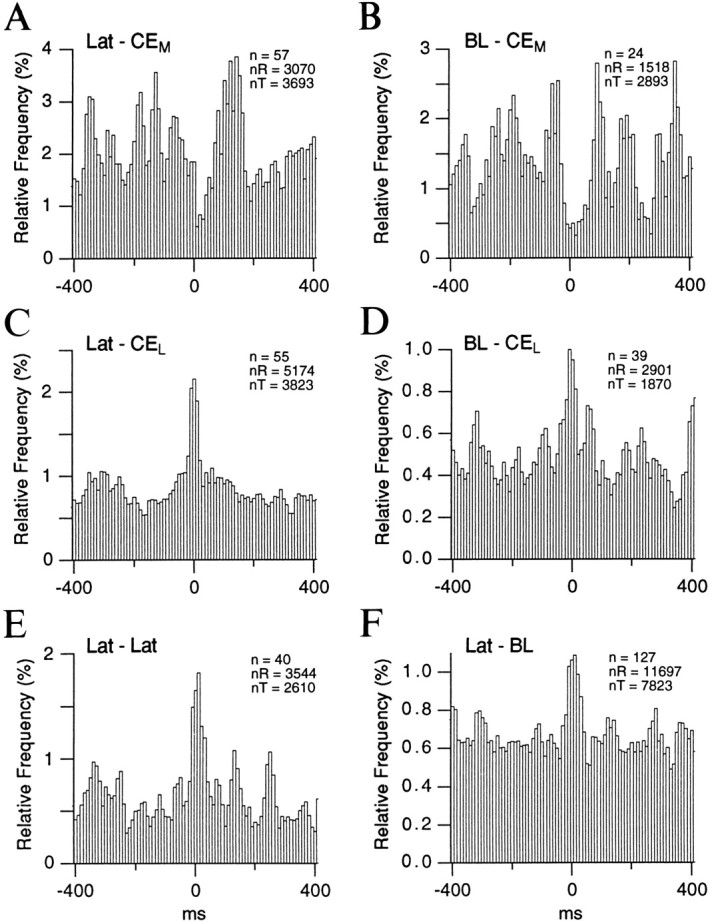
Temporal relationship between the spontaneous activity of lateral, BL, and CE neurons. Population cross-correlograms were computed for pairs of neurons recorded simultaneously in the sites indicated in the top left of each histogram. As in Figure 5, the left nucleus corresponds to the reference cells and the right one to the test cells. Spontaneous epochs were recorded in the waking state and lasted 2–3 min each. Periods contaminated by movements were not considered. Before averaging, the individual cross-correlograms were normalized to the number of spikes generated by the reference cell. The number of cell couples (n), the number of spikes generated by the reference cells (nR), and the number of test cells (nT) are indicated in the top right of each histogram.