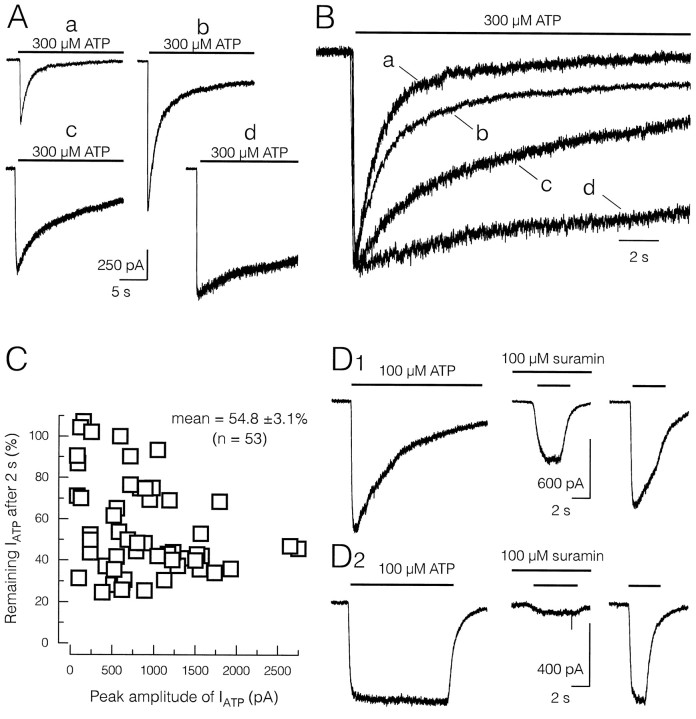
Fig. 6.
Heterogeneous inactivation kinetics ofIATP in different ATP-sensitive RGCs.A, Specimen recordings ofIATP from four different RGCs are depicted to illustrate large differences in the decay kinetics ofIATP. Agonist concentration and application interval are indicated by the bars. Calibration bar applies to all four cells. In the majority of cells, the decay ofIATP exhibited a fast and a slow component (traces a, b, c). However, in some cells the fast component dominated the decay (trace a), whereas only the slow component was present in other RGCs (trace d).B, Superposition of the current responses illustrated inA normalized to the same peak amplitude to facilitate comparison. C, Fraction ofIATP remaining after 2 sec of agonist application plotted against the peak amplitude ofIATP. Agonist concentration was 300 μm. In a majority of RGCs,IATP inactivated within 2 sec to 25–60% of its peak amplitude. However, in some RGCs with relatively smallIATP, the fraction of remaining current was >70%. D, RGCs with slowly or noninactivating current responses showed strong attenuation ofIATP by the P2 receptor antagonist suramin (100 μm). Faster inactivation kinetics ofIATP correlated with weaker sensitivity to suramin. In both cases, IATP recovered almost completely after washout.

