Fig. 6.
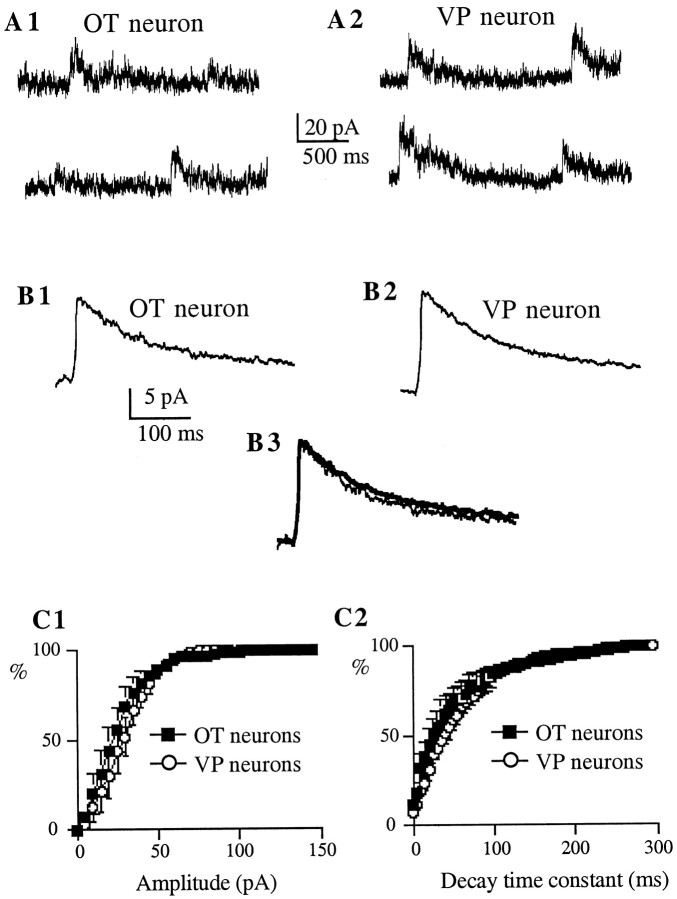
NMDA mEPSCs of OT and VP neurons show similar properties. A, Representative NMDA mEPSCs obtained from immunoidentified OT (A1) and VP (A2) neurons. Synaptic activity was recorded in the presence of bicuculline (20 μm) and NBQX (10 μm), at a holding potential of +60 mV. B, Average of 338 mEPSCs from the same VP neuron (B1) and average of 154 mEPSCs from the same OT neuron (B2). In B3, both responses were scaled to the same peak amplitude to facilitate the comparison of their decay times. Neither the amplitude nor the decay rate was different between cell types (VP neuron trace is inthick line). C, Averaged cumulative distribution histograms of the amplitude (C1) and decay time constant (C2) of NMDA mEPSCs obtained from six OT (squares) and nine VP (circles) neurons, showing similar distributions in both cases (p > 0.05 in both cases; Kolmogorov–Smirnov Test).

