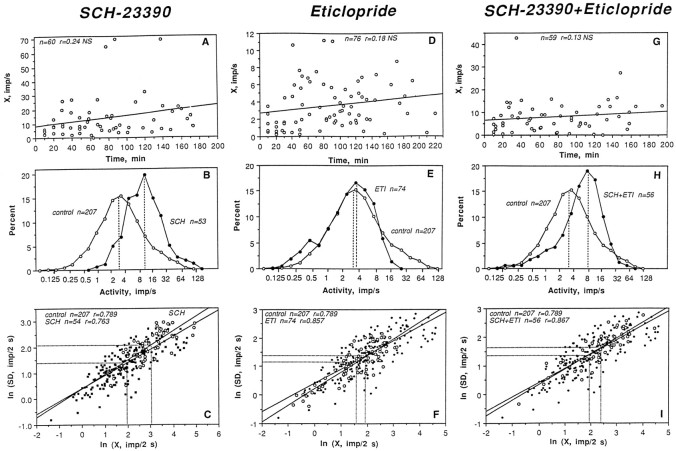
Fig. 2.
Impulse activity of striatal neurons after DA receptor blockade. The top rows indicate dependence of discharge rate (impulses per second) on time after drug administration (minutes). The middle rows depict percent distributions of discharge rate in drug-treated (closed circle) and control (open circle) conditions. Hatched lines show distribution modes. The bottom rowsdepict relationships between discharge rate (X, impulses/2 sec) and SD (impulses/2 sec) of impulse activity shown in ln form for treatment (open symbols) and control (closed symbols) groups. n, Numbers of data points;r, coefficients of correlation.

