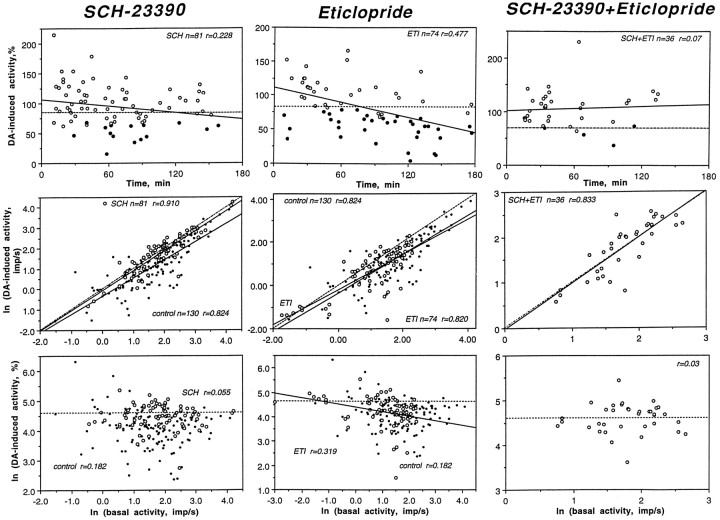
Fig. 6.
Dopamine responses of striatal neurons (20–25 nA ejection current) after DA receptor blockade. The top rows indicate DA-induced activity (percentage) in units recorded at various times after drug administration [filled symbols, inhibitions; open symbols, nonsignificant changes; solid lines, trends (regression); and hatched lines, mean DA-induced change in activity in control]. The middle rows depict relationships between absolute magnitude of DA-induced activity and basal rate for control and drug-treated groups (large open circles, drug-treated state; small closed circles, control). The bottom rows indicate relationships between the relative magnitude of DA-induced (percentage) activity and basal discharge rate for control and drug-treated groups (symbols as in middle row).n, Numbers of data points; r, coefficients of correlation.

