Fig. 2.

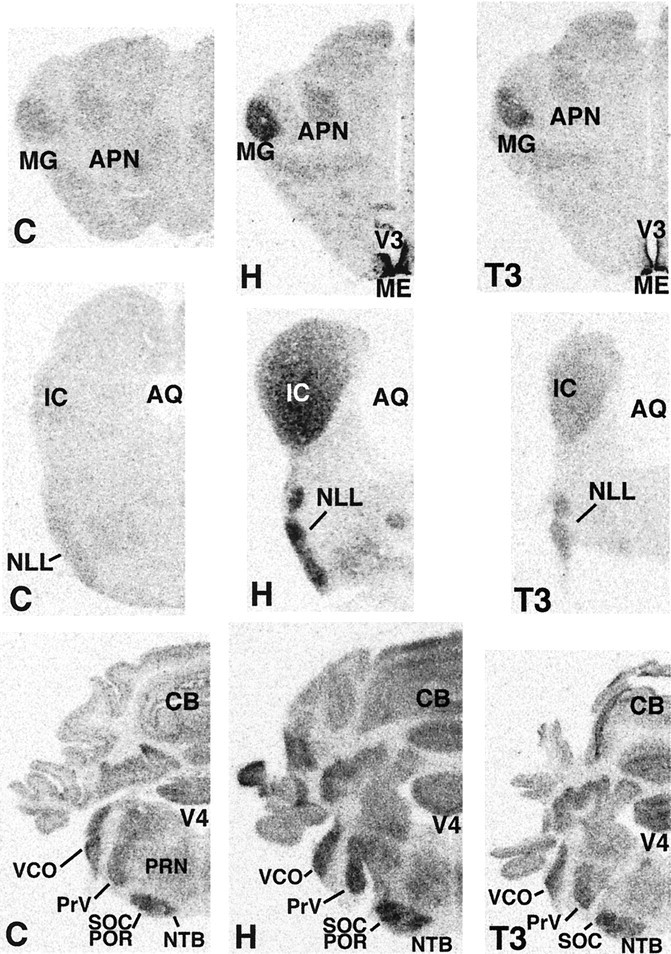
Expression of D2 transcripts in the brain of 15-d-old neonatal rats. C, Normal control rats (left panels); H, hypothyroid rats (middle panels); T3, T3-treated hypothyroid rats (right panels). AQ, Cerebral aqueduct; V4, fourth ventricle.

Expression of D2 transcripts in the brain of 15-d-old neonatal rats. C, Normal control rats (left panels); H, hypothyroid rats (middle panels); T3, T3-treated hypothyroid rats (right panels). AQ, Cerebral aqueduct; V4, fourth ventricle.