
Fig. 4.
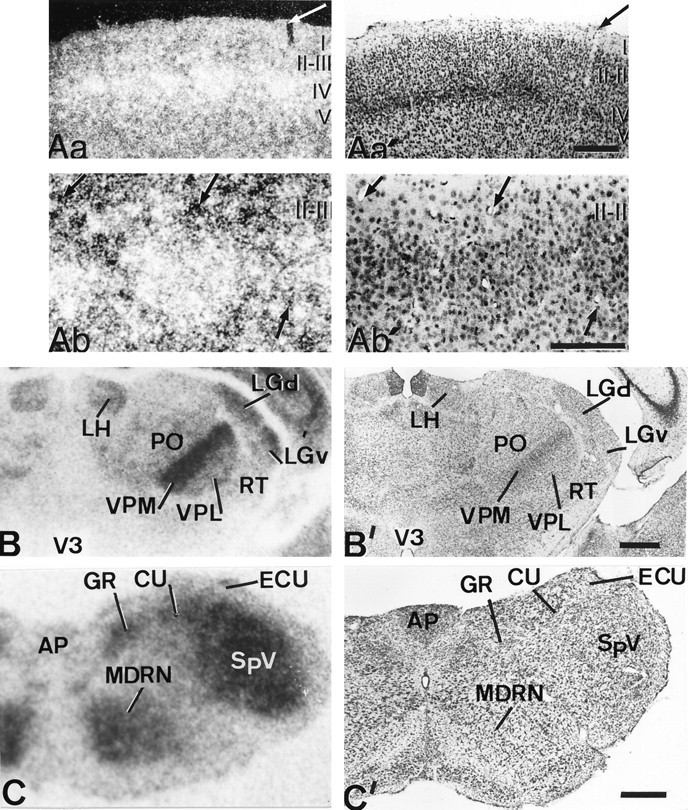
Patterns of D2 expression in the primary somatosensory pathways of hypothyroid rats. Aa is a dark-field, low-magnification photomicrograph of the somatosensory cortex taken from a hybridized section coated with photographic emulsion. Note that high intensity of signal is present in all the cortex but is especially high in the barrels of layer IV;Aa′ is the adjacent section, at the same magnification and bright-field illumination that had been processed as inAa, and was also counterstained with cresyl violet. Thearrows point to adjacent cuts of the same vessel. The fact that the intensity of labeling is much higher within the barrels than in the interbarrel space is addressed at higher magnification inAb and Ab′. Ab shows high concentration of silver grains within a barrel whose limits are defined by Nissl staining (Ab′). Arrows point to the same vessels in both photomicrographs. B,C, Autoradiographs from coronal sections at the thalamic and medullar levels, respectively; B′,C′, the corresponding adjacent sections stained with cresyl violet. The highest signal is associated with relay nuclei of the lemniscal pathway, i.e., gracile and cuneate nuclei and VPM and VPL. A high-intensity signal is also associated with the spinothalamic pathway, i.e., SpV and PO. In both pathways, the trigeminal component has the strongest D2 mRNA expression. AP, Area postrema;ECU, external cuneate nucleus; LGd andLGv, lateral geniculate nucleus of the thalamus, dorsal and ventral parts. Layers of the cerebral cortex are shown inroman numerals. Scale bars, 500 μm.