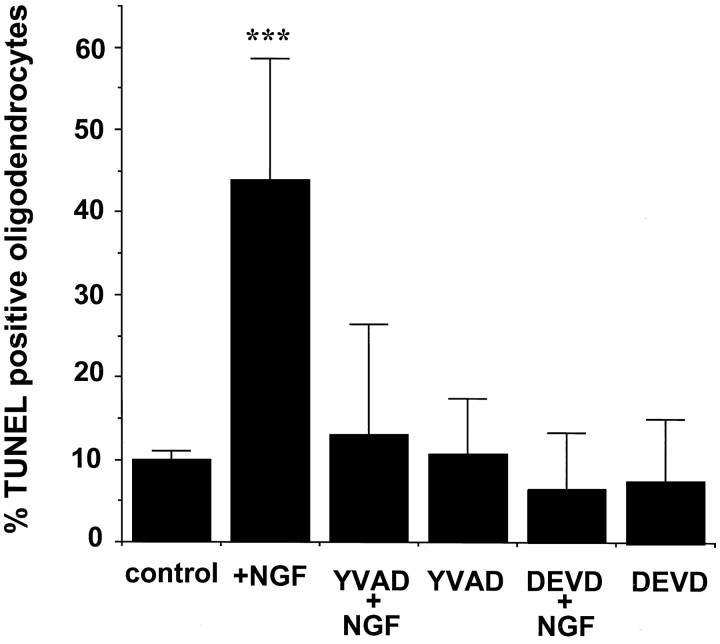
Fig. 2.
Quantification of apoptotic oligodendrocytes in the presence of the caspase inhibitors. Bar graphs indicate O1–TUNEL double-positive-stained cells in each treatment expressed as percentage of total O1-positive cells. Cells were counted in at least three separate fields across the large diameter of each coverslip. The results represent the mean ± SEM of the cells from nine separate determinations. Asterisks indicate that the percentage of TUNEL-positive oligodendrocytes in the NGF treatment is statistically significant when compared with the remaining treatments; two-tailed t test; p < 0.01.

