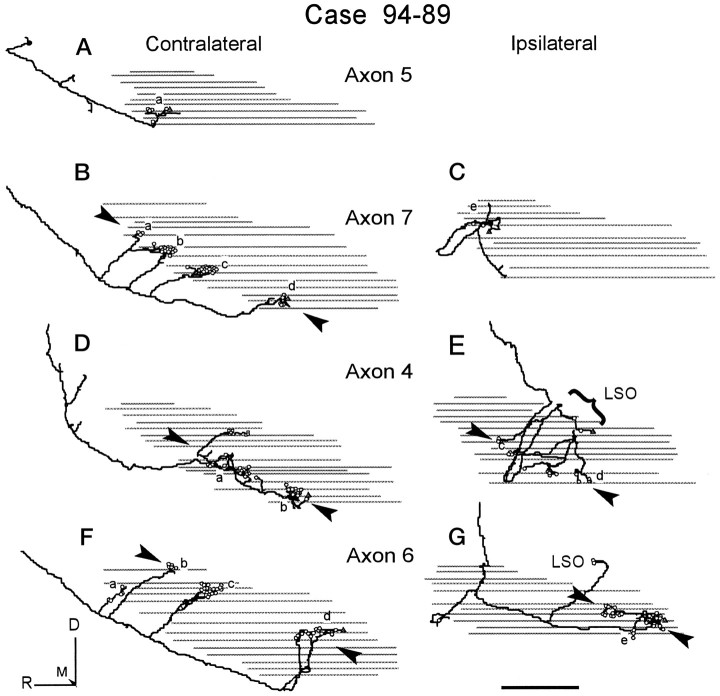
Fig. 10.
Sagittal view of each half of the four reconstructed axons in case 94–89. Symbols, gray lines, arrowheads, and arrows as in Figure 9. A, Axon 5 (Fig. 6B).B, C, Axon 7 (Fig. 5A).D, E, Axon 4 (Fig. 4C).F, G, Axon 6 (Fig. 5B). Small steps are an aliasing artifact and are not present in the data. Scale bar, 1 mm.

