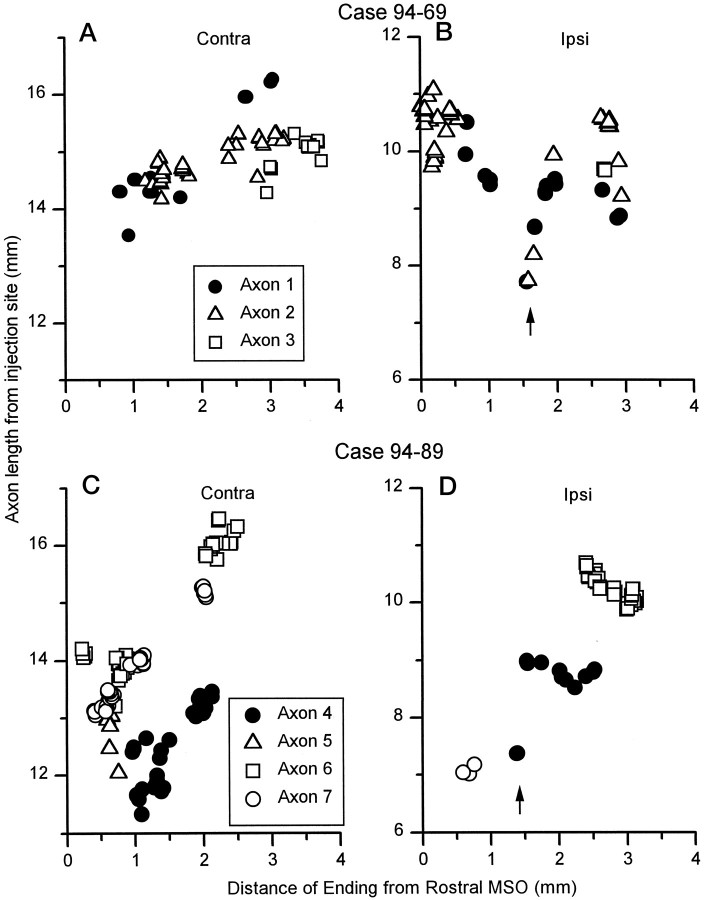
Fig. 11.
Length of axon from the injection site to each individual axonal ending is plotted as a function of the distance of the ending from the rostral MSO. These plots were made for the seven completely reconstructed axons in this study. Ipsilaterally, some axons from both cases (axons 1, 2, 4) gave off short daughter branches with terminal boutons immediately after branching to the ipsilateral MSO. These terminals produced a “dip” in the plot (arrows).

