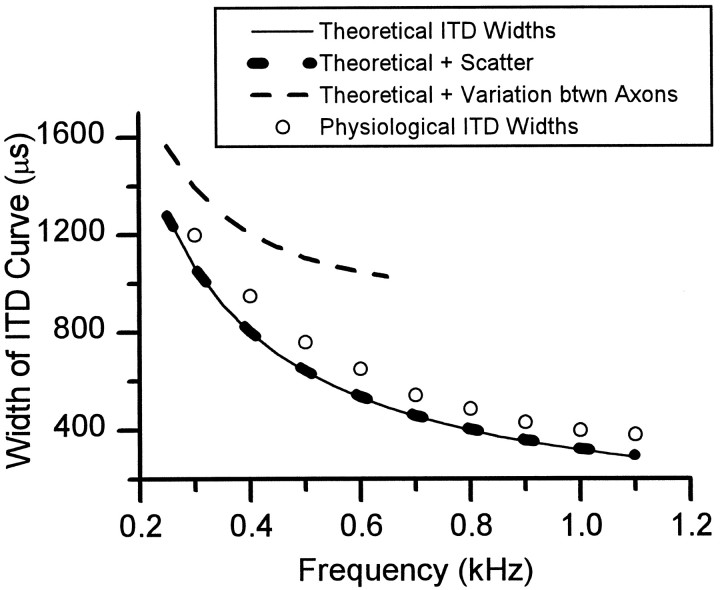
Fig. 14.
Measured and predicted widths of interaural delay curves in the MSO. Open circles are widths measured at 50% of maximum response (Fitzpatrick et al., 1997). Solid line denotes theoretical widths at each frequency (see Materials and Methods). Bottom, thick dotted line indicates the effect of scatter within individual axons caused by variation of axon collateral length. For the contralateral MSO of case 94–89, the average residual error for the linear regression between conduction time and MSO location was ±23 μsec (n = 3). For the ipsilateral MSO, it was ±10 μsec (n = 2). These times represent the increase in the variability of travel times from the AVCN of either side to the MSO. This increase in variability corresponds to an increase in tuning width of 59 μsec. The top, dashed lineindicates the effect of variation in length between axons. The average difference in travel time between axons was estimated as ∼400 μsec, and the corresponding increase in tuning width was estimated as ∼900 μsec.

